Quantitative development
Quantitative development is the process of building, implementing, and maintaining financial models and algorithms, particularly in trading and investment strategies. Quants combine mathematics, statistics, and computer science to create systems that analyse large datasets, identify patterns, and automate financial decision-making.

Sierra Chart for quantitative finance
Sierra Chart provides a robust platform for developing, testing, and executing trading strategies at high speeds. It empowers quants with detailed data, customisable algorithms and comprehensive analytics.
Ultra-low-latency execution for HFT
For quant developers focused on high-frequency trading (HFT), Sierra Chart offers ultra-low-latency execution, essential for building and running trading algorithms that rely on precise timing. Its direct access to exchanges without routing delays ensures faster and more reliable order execution, which is crucial for quants developing strategies dependent on microsecond-level execution speeds.
Advanced customisation with ACSIL
Sierra Chart’s Advanced Custom Study Interface and Language (ACSIL) is a robust C++-based environment that allows quant developers to create custom studies, algorithms, and indicators. For those building proprietary trading models, the ability to deeply customise strategies, backtest, and integrate them with Sierra Chart’s core infrastructure makes it an ideal choice.
Comprehensive market data for analysis
Quantitative analysts rely heavily on market data to develop trading strategies, test models, and optimise portfolios. Sierra Chart provides access to a wide range of historical and real-time data, including tick-level data and detailed order book data like bid/ask volumes, making it a valuable resource for quants developing predictive models or high-frequency strategies.
Order flow analysis for liquidity insights
Sierra Chart offers detailed order flow and volume analysis tools, such as the Volume by Price study and Delta Volume analysis. These tools help quants track market absorption, liquidity levels, and other factors in price formation. These features are essential for quantitative analysts who rely on liquidity and order flow to build market-making or arbitrage models.
Efficient resource usage for backtesting
For quant developers running multiple simulations or backtests, Sierra Chart is lightweight and optimised to run efficiently on various hardware setups. This efficiency ensures that quants can execute large-scale backtests on computationally heavy strategies without significant performance issues, helping accelerate the research process.
Integrated backtesting and strategy execution
Sierra Chart supports seamless backtesting and live execution of algorithmic strategies. Quants can develop models, backtest them on historical data, and then deploy them in live environments without switching platforms. This capability provides a streamlined workflow for those working on automated trading strategies.
Real-time data feeds for adaptive strategies
In quantitative trading, access to real-time data is crucial for executing adaptive strategies. Sierra Chart integrates with numerous real-time data feeds, including Rithmic, CQG, and Denali, allowing quants to build and implement strategies that adapt to real-time market conditions.
Competitive subscription fees
Sierra Chart provides cost-effective access to features typically found in higher-priced platforms. This advantage is desirable to independent quant developers and analysts looking for advanced features—such as tick data, order flow analysis, and low-latency execution—without the heavy price tag of institutional-grade platforms.
Support for high-performance algorithms
For quants building complex algorithmic trading systems, Sierra Chart’s flexibility and efficiency make it an ideal platform whether developing machine learning models, optimising portfolios, or testing mean-reversion and momentum strategies. Sierra Chart’s toolset is perfect for quants looking to build high-performance systems.
Python improves investment management strategies
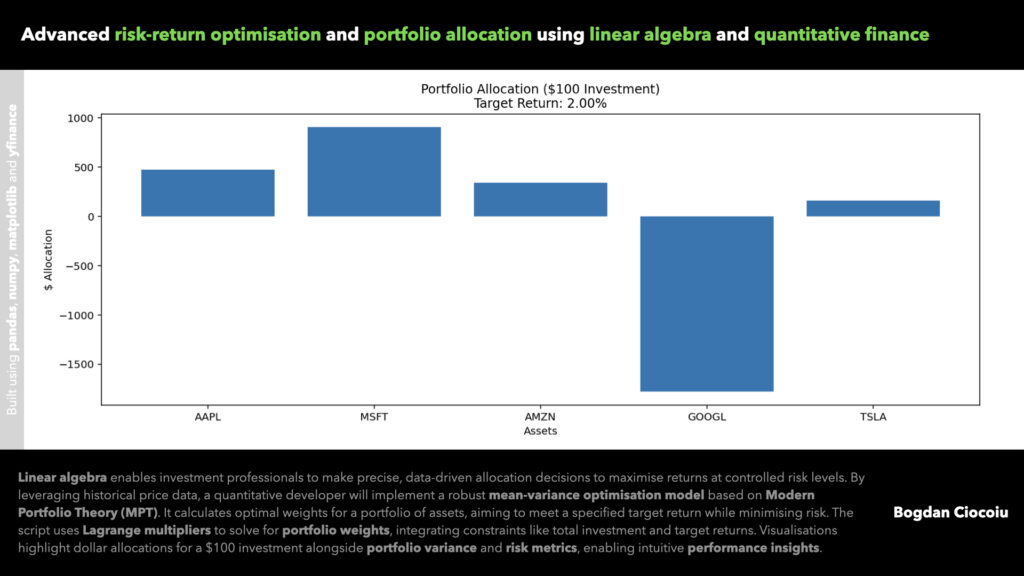
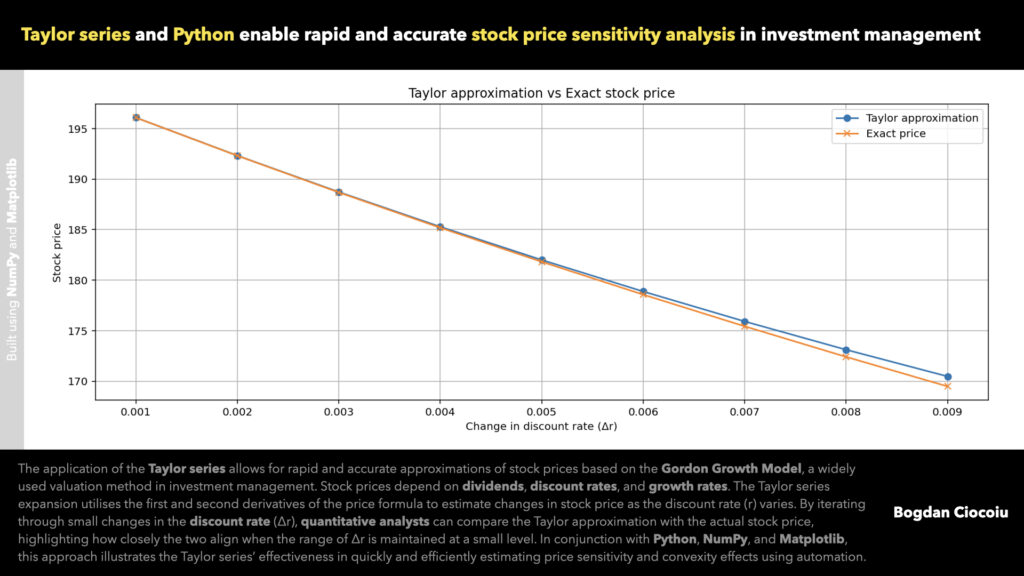
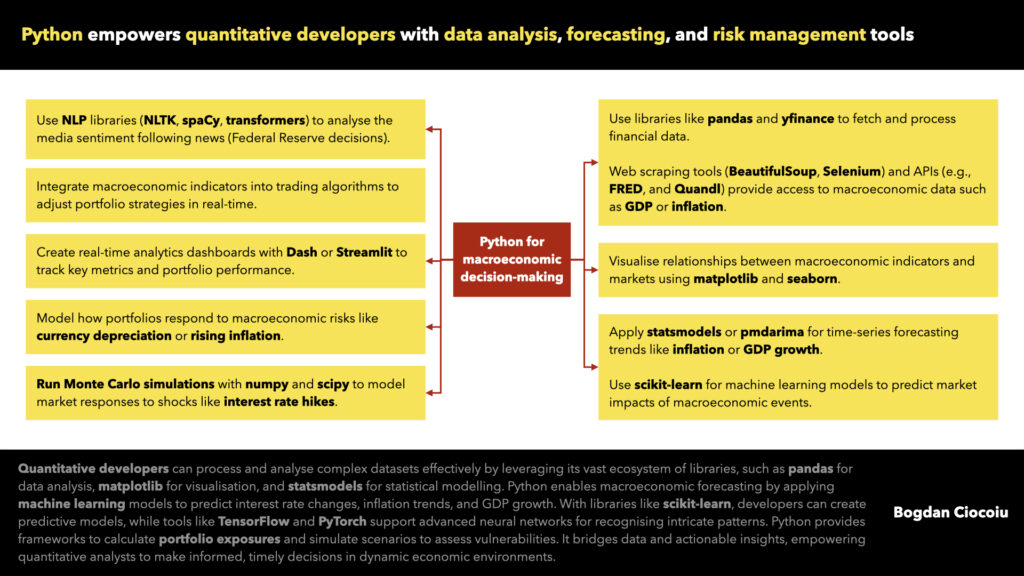
Python unlocks numerous opportunities to understand and interpret market volatility using quantitative analysis and development capabilities.


Python libraries, modules and tools
The most utilised Python libraries relevant to high-frequency trading (HFT), investment management and charting include pandas, NumPy and TA-Lib
pandas
Provides data structures and analysis tools for time series and structured data.
NumPy
Supports large, multi-dimensional arrays and matrices and operations on them.
TA-Lib
Includes 150+ technical analysis indicators, such as RSI, MACD, and moving averages.
matplotlib
A 2D plotting library used to create static, animated, and interactive visualisations.
scikit-learn
Provides machine learning tools, including regression, classification, and clustering.
statsmodels
Statistical models, hypothesis testing, and data exploration for time series.
PyAlgoTrade
A backtesting library for algorithmic trading strategies in Python.
zipline
A backtesting engine for event-driven, quantitative investment strategies.
yfinance
Enables access to Yahoo Finance data for stock and historical price data analysis.
arch
Provides tools for financial econometrics, including volatility models like GARCH.
bokeh
Offers interactive plots and dashboards for financial and other time series data.
ccxt
Cryptocurrency exchange trading library supporting numerous exchange APIs.
plotly
Interactive plotting library for financial, statistical, and scientific data visualisations.
quandl
Financial, economic, and alternative datasets with easy API access for investment research.
pymc3
Probabilistic programming for Bayesian statistical modelling and machine learning.
seaborn
Statistical data visualisation built on top of matplotlib.
pyfolio
Portfolio and risk analytics library designed to be used with backtrader and zipline.
finta
A library with financial indicators for technical analysis and trading.
alphalens
Performance analysis of predictive (alpha) stock factors for trading strategies.
pyti
Technical indicators for algorithmic trading and financial analysis.
empyrical
Provides financial performance metrics such as Sharpe ratio and volatility.
C++ (ACSIL) enables analysts and traders to stress-test strategies
Sierra Chart is a powerful trading platform. It becomes even more powerful and flexible for technical traders and quantitative analysts who wish to code strategies and undertake thorough low-level backtesting using tick data.


C++ (ACSIL) libraries and modules
Sierra Chart’s bespoke study development leverages C++. An additional framework, Advanced Custom Study Interface and Language (ACSIL), is attached and introduces UI, trading, and financial data-specific capabilities.
s_VolumeAtPriceV2
Provides volume profile data at each price level, including bid/ask volumes and delta.
GetMarketDepthBars
Retrieves market depth data, showing bid/ask quantities at price levels for order flow analysis.
Subgraph
Represents chart data for plotting or analysis, storing values like lines, bars, or indicators.
GetTimeAndSales
Accesses time and sales data, including trade sizes, prices, and timestamps for flow analysis.
AddLineUntilFutureIntersection
Draws a line at a price and bar, updating dynamically until intersected by price.
sc.GetIndexOfHighestValue
Finds the highest value index in a data array (time series/volumetric) for peak identification.
Development languages
C++, Python, and PHP serve distinct purposes for different needs. C++ is ideal for algorithmic trading and real-time financial systems. Python excels in data analysis and machine learning. PHP is the go-to for web development.
PHP
- I leverage PHP to build browser-based investment platforms, enable seamless interactions, create financial reports, and manage portfolios.
- I leverage PHP to connect to databases (like MySQL) to manage and query historical financial transactions around dividends and earnings dates.
- Being open-source, PHP helps reduce costs when developing LAMP (Linux, Apache, MySQL, PHP) investment management applications.

C++
- I use C++ to develop high-speed financial algorithms using Sierra Chart’s algorithmic trading, risk management, and portfolio optimisation capabilities.
- Using Sierra Chart’s backtesting capabilities, I recommend C++ for building high-frequency trading (HFT) strategy simulations.
- C++ provides end-to-end execution of low-latency applications and integrates with diverse data providers and brokers, including Interactive Brokers.

Python
- Python’s powerful libraries (pandas, NumPy) are widely used for analyzing financial data, enabling detailed portfolio analysis and forecasting.
- Python excels in automating investment processes and integrating machine learning models for predictive analytics in asset management.
- Its simplicity and readability allow quant developers to quickly build and test investment strategies, making it popular for developing quantitative trading systems.

“Quantitative analysis and development are the only ways to interact with the financial markets.”

Bogdan Ciocoiu
Partner
Articles
Let us stay connected
Keen to be in touch? Reach out on LinkedIn.
