In investment management, precision and efficiency are paramount when analysing how market variables impact stock prices. The Taylor series, a powerful mathematical tool, provides a robust framework for understanding price sensitivities and convexity effects.
One application for the Taylor series is to approximate stock prices using the Gordon Growth Model, a widely recognised approach for dividend discount valuation.
The Gordon Growth Model
The Gordon Growth Model evaluates a stock’s intrinsic value by dividing the expected dividend (D) by the difference between the discount rate (r) and the growth rate (g). This simple yet powerful formula helps investors determine whether a stock is over or undervalued. However, market dynamics often cause slight changes in the discount rate, which can significantly affect stock prices. Understanding these sensitivities is critical for informed decision-making.
Taylor series
The Taylor series expansion offers an efficient method for approximating the stock price’s response to changes in the discount rate. By incorporating the first derivative (sensitivity) and second derivative (convexity), the Taylor approximation captures both linear and quadratic effects of rate changes, making it an invaluable tool for sensitivity analysis. This exercise emphasises how the Taylor series aligns closely with exact calculations when applied to small changes in the discount rate (Δr).
The methodology
The exercise begins with defining essential stock parameters:
Dividend per share (D = $10)
Discount rate (r = 8%)
Growth rate (g = 3%)
The original stock price is calculated using the Gordon Growth Model formula:
Stock price = D/(r - g)The Taylor series approximation comes into play. The first derivative (price sensitivity) and second derivative (convexity effect) are derived from the stock price formula. These derivatives quantify how the stock price responds to minor variations in r.
For a series of small changes in the discount rate (Δr), the Taylor approximation is computed as:
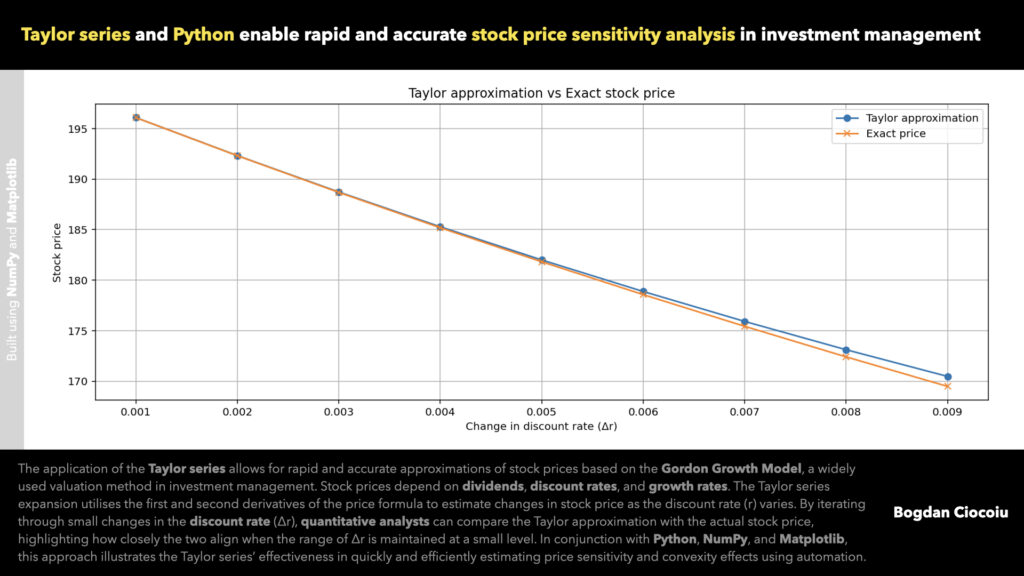
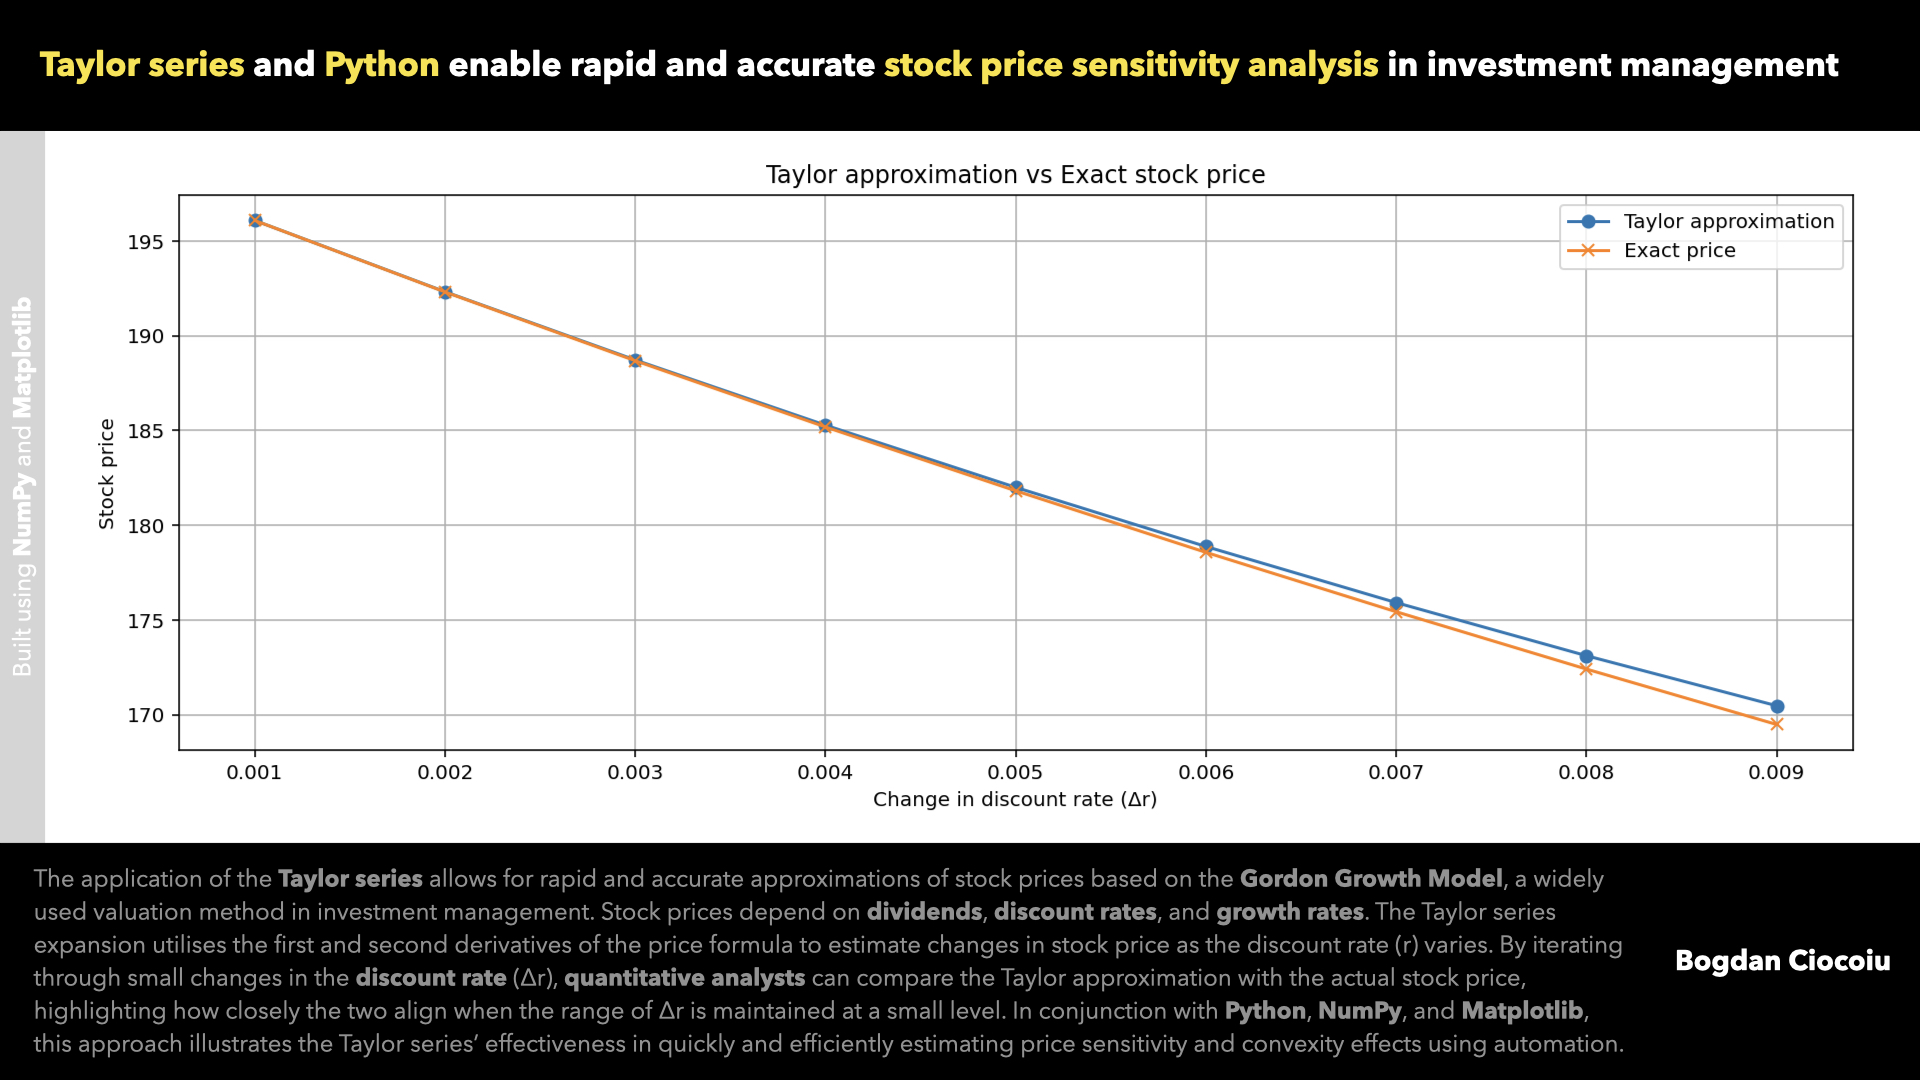
Approximate price = Original price + (First derivative * Delta r) + 1/2 * (Second derivative * Delta r^2) The exact stock price for each Δr is calculated directly using the Gordon Growth Model. The exercise visually demonstrates their alignment by plotting the Taylor approximation and actual values, particularly within a constrained range of Δr.
Visualisation
The plot illustrates the relationship between the Taylor approximation and exact stock prices as Δr varies. When the range of Δr is small (e.g., between 0.001 and 0.01), the two curves closely align, underscoring the Taylor series’ accuracy. This alignment highlights the series’ ability to provide quick and precise estimates without the computational burden of recalculating the exact price for every scenario.
Practical applications
The insights gained are directly applicable to the investment management community. Portfolio managers, quantitative analysts, and risk managers can leverage this approach to:
- Quickly estimate the impact of small market changes on stock prices, supporting agile decision-making.
- Understand the nonlinear effects of variable shifts, particularly in volatile markets.
- Use price approximations to assess risk-adjusted returns efficiently.
- Avoid repetitive exact calculations by employing accurate approximations within constrained ranges.

Benefits of the Taylor series approach
- Speed
- Accuracy
- Flexibility
- Visualisation
This exercise demonstrates how the Taylor series and the Gordon Growth Model equip quant professionals with the tools to conduct rigorous sensitivity analysis. This approach empowers the investment management community to make data-driven decisions confidently by aligning mathematical precision with practical applications.


Leave a Reply
You must be logged in to post a comment.