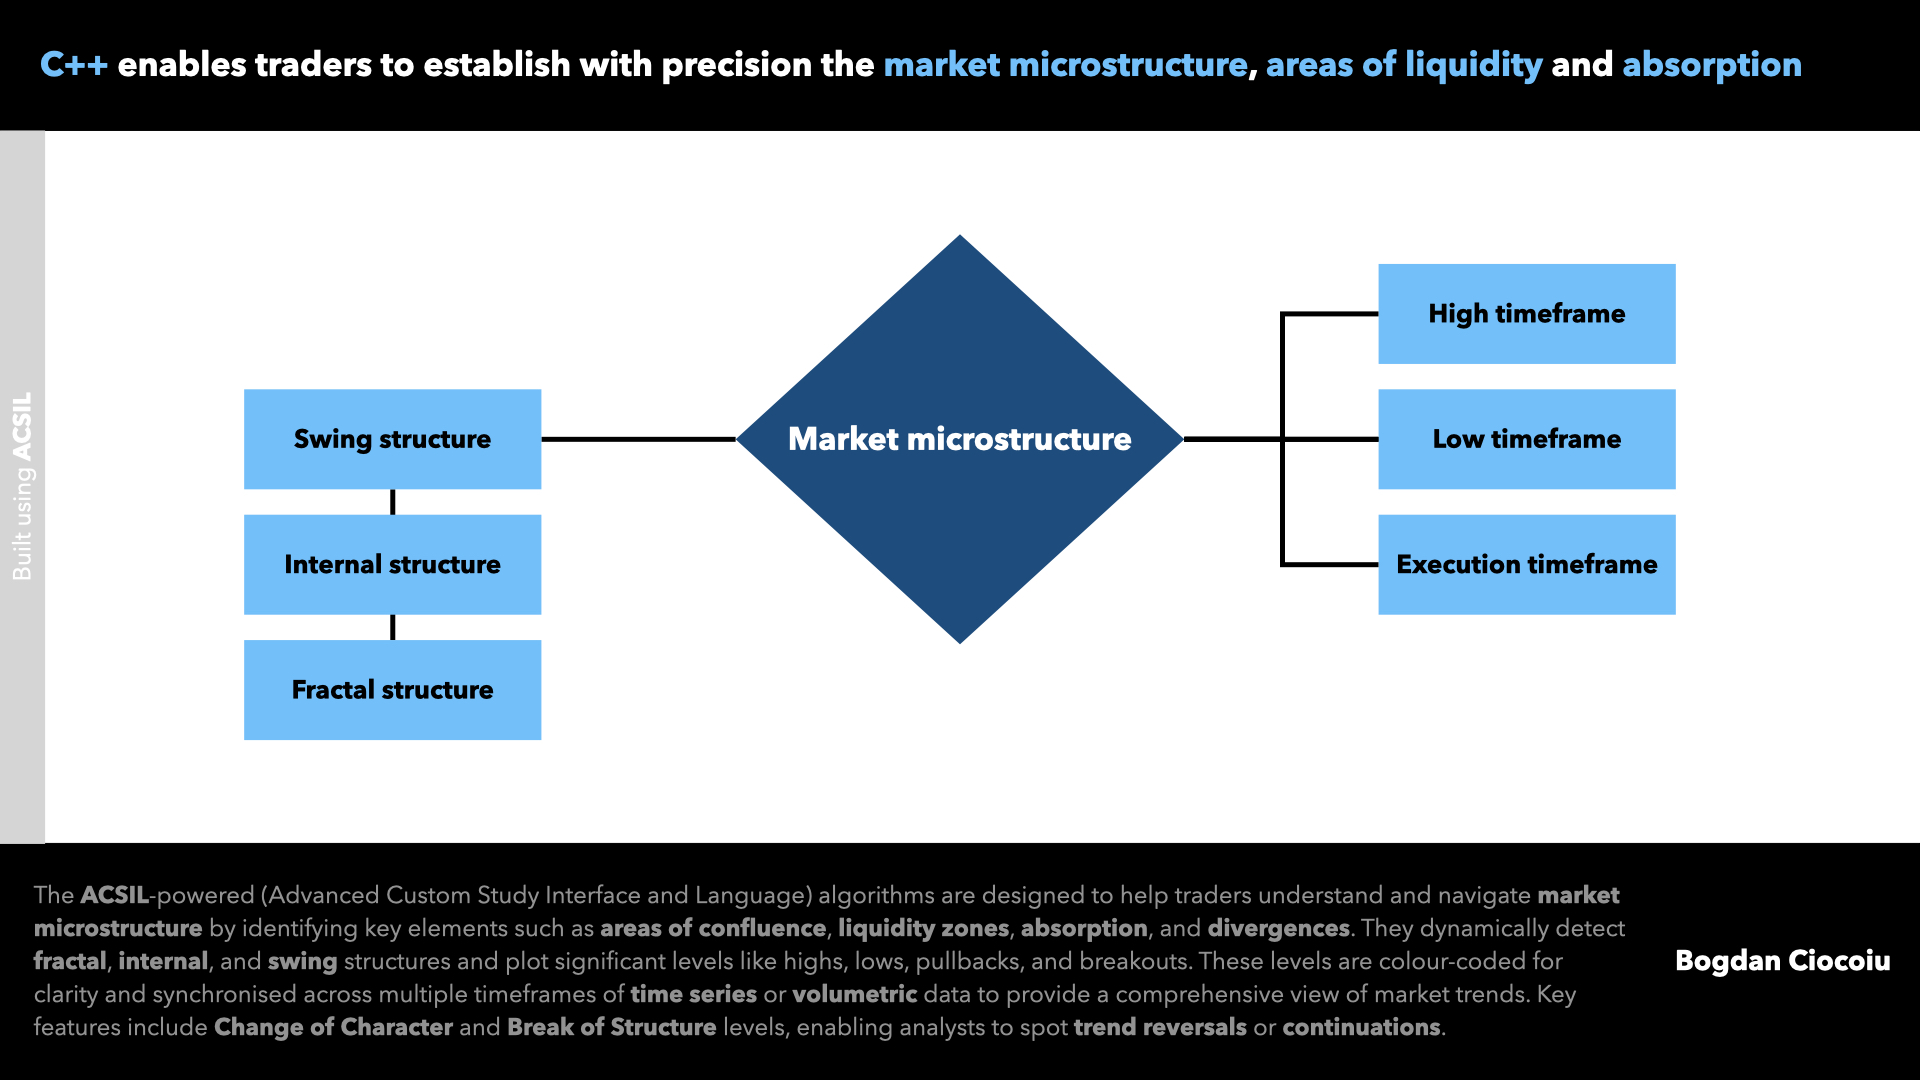
A deep understanding of market microstructure is paramount to avoid getting caught in consolidations or competing against dominant market participants.

Confluence, liquidity, absorption, and divergences are critical in identifying high-probability trade opportunities.
While nuanced, these concepts form the backbone of successful trading strategies. I developed a robust Advanced Custom Study Interface and Language (ACSIL) indicator in Sierra Chart to aid traders and quantitative analysts in this pursuit.

The significance of market microstructure
- Confluence areas refer to price levels where multiple indicators or technical analysis tools align, enhancing the probability of a reaction at that level. These zones often mark significant support or resistance areas.
- Liquidity zones represent price levels with a high volume of pending orders. Institutions seek to execute large trades without significant slippage during sharp market movements, so these zones are often targeted.
- Absorption occurs when a dominant player offsets aggressive orders on the opposite side, indicating a potential reversal or continuation.
- Divergences signal discrepancies between price movements and underlying operating indicators, highlighting potential weaknesses or strengths in a trend.

The studies
The indicators are based on logic and seek to identify and visually represent market microstructure phenomena.
The study integrates advanced reasoning and efficient line-drawing techniques to enable traders to understand market phasing and whether the current state, such as trend, consolidation, pullback or overextension, is favourable.

Features
- Identifies fractal highs and lows, highlighting key reversal points.
- Tracks change market structure through real-time visualisation of CHoCH (Change of Character) and BOS (Break of Structure).
- Separates price movements into internal (short-term) and swing (longer-term) structures, enabling traders to understand the market context across multiple timeframes.
- Automatically plots lines to indicate key levels (e.g., highs, lows, pullbacks) and their interactions with the current price.
- Supports solid and dotted lines, with colour coding to distinguish various levels and movements.
- Allows traders to turn specific structures (fractal, internal, swing) on or off via input settings.
- Allows users to perform cosmetic colour changes.

Practical applications
The study is a versatile tool suited for a range of trading strategies:
- Use fractal and internal levels to identify high-probability entry points within microstructural zones.
- Look for absorption patterns near liquidity zones for quick trades.
- Combine swing structure levels with divergences to pinpoint potential reversals.
- Monitor CHoCH events for early indications of trend changes.
- Rely on BOS signals to confirm the strength of ongoing trends.
- Use pullbacks to enter trades in the direction of the prevailing trend.

The study bridges the gap between theory and practice, equipping traders with actionable insights into market microstructure. By visualising areas of confluence, liquidity, absorption, and divergences, the indicator transforms complex price action into a clear, structured framework.


Leave a Reply
You must be logged in to post a comment.