Risk management is paramount for banks, financial institutions, and investment firms. Accurately predicting potential portfolio losses, especially during market downturns, can mean the difference between resilience and vulnerability. Python has emerged as an indispensable tool for quantitative developers, offering flexibility and precision in risk modelling. Using Python, one can calculate Value at Risk (VaR), a key metric for portfolio risk assessment, leveraging probability distributions and visualisation.
Portfolio risk
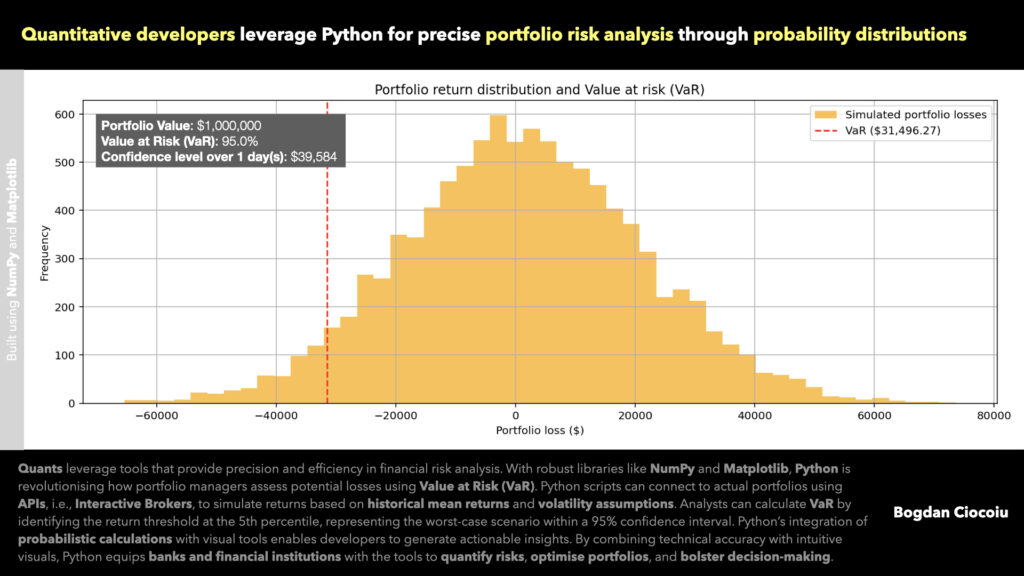
The foundation of this analysis lies in simulating portfolio returns using a normal distribution. Python’s NumPy library generates 10,000 random daily returns by inputting assumptions for mean returns and volatility, enabling developers to model potential portfolio outcomes based on historical data or projected market conditions.
Python’s ability to handle large-scale computations efficiently makes it suitable even for portfolios with extensive assets. This scalability allows financial institutions to extend risk analysis across multiple portfolios or asset classes, streamlining operations and ensuring thorough evaluations.
Value at Risk (VaR)
VaR quantifies a portfolio’s potential loss within a specified confidence interval. For a 95% confidence level, Python calculates the return threshold at the 5th percentile of simulated returns. This threshold represents the worst-case scenario, enabling portfolio managers to gauge the maximum expected loss under normal market conditions.
Python converts this percentage loss into dollar terms, factoring in the portfolio’s total value and time horizon. The resulting VaR provides a clear and actionable risk metric that informs decision-making, whether for rebalancing portfolios or preparing contingency plans.
Visualisations
Quantitative analysis is only as impactful as its ability to communicate results effectively. Python’s Matplotlib library transforms abstract risk metrics into intuitive visualisations. Histograms of simulated portfolio losses highlight outcomes’ distribution, with a vertical line marking the VaR threshold.
These visuals serve dual purposes:
- Quantitative developers and portfolio managers gain a clearer understanding of portfolio dynamics.
- The intuitive representation of risk ensures that complex financial concepts are accessible to investors and decision-makers.
Benefits
Python’s computational power and flexibility make it the ideal tool for quant developers.
- Python automates complex calculations, reducing manual effort and increasing accuracy in risk modelling.
- Whether analysing a single portfolio or an entire index, Python’s libraries handle large datasets seamlessly.
- Developers can tailor the VaR calculation to specific asset classes, industries, or risk factors.
- Python’s open-source nature eliminates licensing costs, making advanced risk analysis accessible even to smaller firms.
Practical applications
Quant developers can extend this Python-based VaR model to various applications:
- Simulate market shocks by adjusting volatility parameters to understand the impact on portfolio risk.
- Combine VaR with macroeconomic data to anticipate portfolio performance under different economic conditions.
- Use Python to integrate VaR into portfolio optimisation algorithms, balancing returns with acceptable risk levels.

Python bridges the gap between academic risk models and real-world applications. Concepts like VaR, once confined to theoretical finance, are now actionable metrics that drive industry decisions. By leveraging Python, quantitative developers empower financial institutions to measure risk and use these insights to build more resilient strategies.


Leave a Reply
You must be logged in to post a comment.