
In quantitative finance, having the right tools is crucial to success. The TA-Lib (Technical Analysis Library) is a powerful resource that every quant developer and quantitative analyst should be familiar with. TA-Lib allows users to seamlessly integrate advanced financial analytics into their workflow by providing a comprehensive range of technical analysis functions in Python.
Making quick decisions is critical in a dynamic environment with volatile financial markets. Recruitment agents and hiring managers seeking top quantitative talent should recognise the importance of tools like TA-Lib in enabling candidates to stand out.
What is TA-Lib?
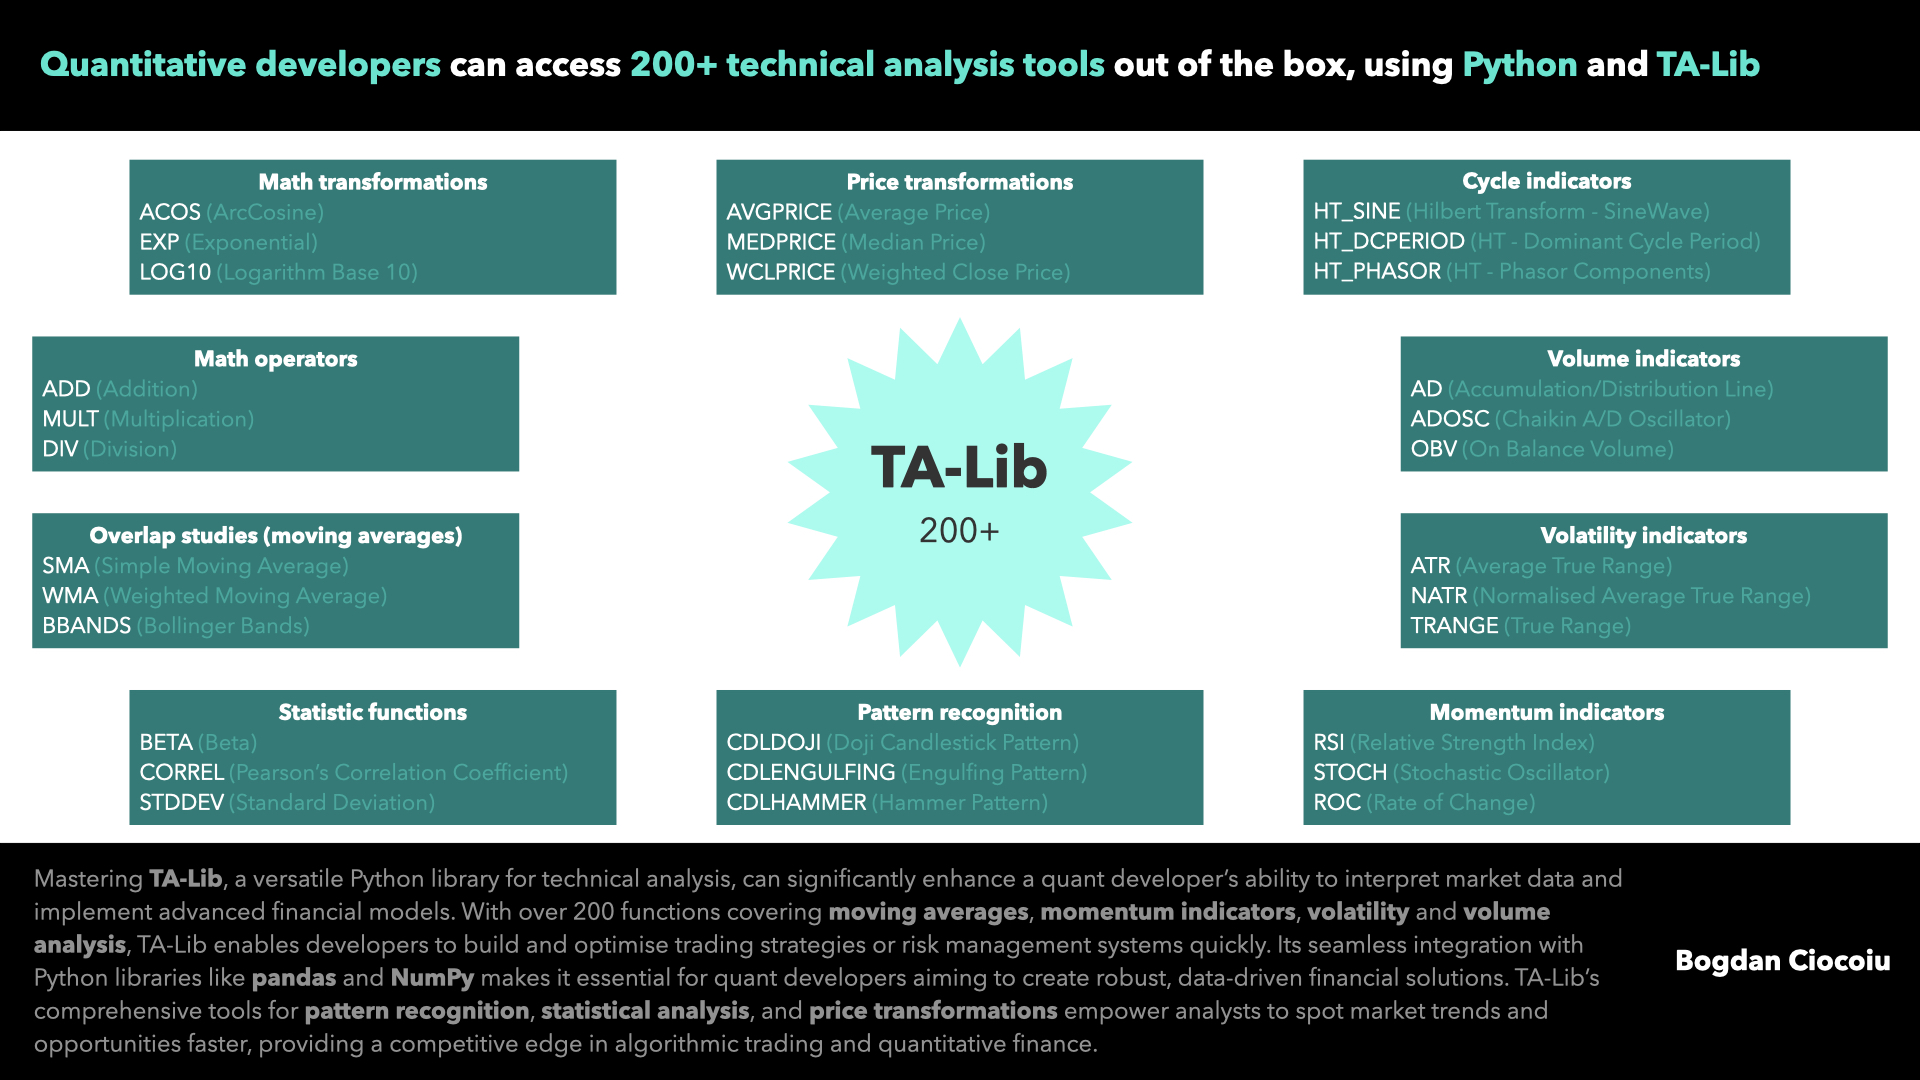
TA-Lib is an open-source library offering a vast array of technical indicators that are pivotal in financial data analysis grouped based on the specific types of analysis they enable, such as trend detection, momentum analysis, volatility measurement, and volume-based strategies. For a quant developer, these functionalities are indispensable when designing and implementing trading strategies, as they help to generate buy and sell signals, identify market conditions, and understand price behaviours.
Overlap studies (moving averages)
Moving averages help smooth out short-term fluctuations in price data and highlight trends; however, they generally introduce lag. Quant analysts frequently rely on these tools to reduce noise and focus on longer-term price movements. TA-Lib offers multiple variations of moving averages SMA (Simple Moving Average), EMA (Exponential Moving Average), and TEMA (Triple Exponential Moving Average) to further enhance trend detection by reducing lag, helping quants react faster in dynamic markets.
Momentum indicators
Momentum indicators are essential for identifying overbought or oversold conditions, enabling quants to gauge the strength of a trend (i.e., or establish when the trend’s strength is likely to decrease). TA-Lib offers powerful tools like RSI (Relative Strength Index) and MACD (Moving Average Convergence Divergence)
Volatility indicators
Understanding volatility is key to managing risk, and TA-Lib offers multiple volatility-based metrics: ATR (Average True Range) or TRANGE (True Range)
Volume indicators
Volume data offers insight into the strength of a price movement. Volume-based indicators such as OBV (On-Balance Volume) and AD (Accumulation/Distribution Line) help evaluate the commitment behind price moves and identify divergences that may signal potential reversals.
For quants, volume indicators provide critical information that confirms trends or signals potential reversals.
Cycle indicators
Cycle indicators such as HT_SINE and HT_DCPERIOD are valuable in detecting recurrent patterns or cycles within financial time series data. These tools allow analysts to identify periods when prices may follow predictable, cyclical behaviours.
Pattern recognition
TA-Lib includes pattern recognition tools that help identify classic chart patterns, such as CDLDOJI (Doji Candlestick Pattern) or CDLHARAMI (Harami Pattern).
Statistical functions
TA-Lib’s statistical functions, including BETA, CORREL, and STDDEV, allow quants to perform advanced statistical analysis on financial time series data.
Essential tool for quant developers
Quantitative finance heavily relies on interpreting market data and transforming it into actionable insights. TA-Lib provides a ready-made library of tools to achieve exactly this. For quant developers and analysts, the benefits of TA-Lib include:
- Efficiency: It reduces the need to implement complex technical indicators manually, saving significant time and effort in the development process.
- Versatility: With over 200 functions, quants can easily apply indicators tailored to their specific needs, whether working with equities, futures, or options.
- Integration with Python: Python is the language of choice for most quant developers due to its simplicity and powerful libraries.
TA-Lib’s seamless integration with Python allows developers to use indicators directly within data pipelines built with pandas, NumPy, and other popular libraries.
Finding candidates proficient in tools like TA-Lib is key to identifying top-tier talent in quantitative finance. Quants adept in using technical analysis libraries like TA-Lib can efficiently design, test, and optimise algorithmic trading strategiesor risk management models, giving their firm a competitive edge. Additionally, candidates who can creatively apply these indicators—whether through automated trading algorithms or quantitative portfolio management—are highly valuable assets for any financial institution.
By mastering TA-Lib, quant developers and analysts can significantly enhance their ability to analyse market conditions, make data-driven trading decisions, and provide quantitative insights that directly impact investment strategies and risk management practices. As the financial industry becomes increasingly data-driven, tools like TA-Lib are no longer optional but essential for success.
Leave a Reply
You must be logged in to post a comment.