
Leveraging Python and its powerful libraries like pandas and matplotlib provides a significant advantage in analysing financial data, especially when interpreting data feeds from centralised exchanges that include bid and ask data.
The pandas library is paramount for managing and manipulating structured data in financial markets. A centralised exchange financial data feed that includes bid and ask volumes typically provides a time series of prices, volume, and other metrics. With pandas, quant developers can efficiently handle this data set, clean it, filter specific timeframes, and calculate derived variables such as the spread between bid and ask prices or the volume delta.
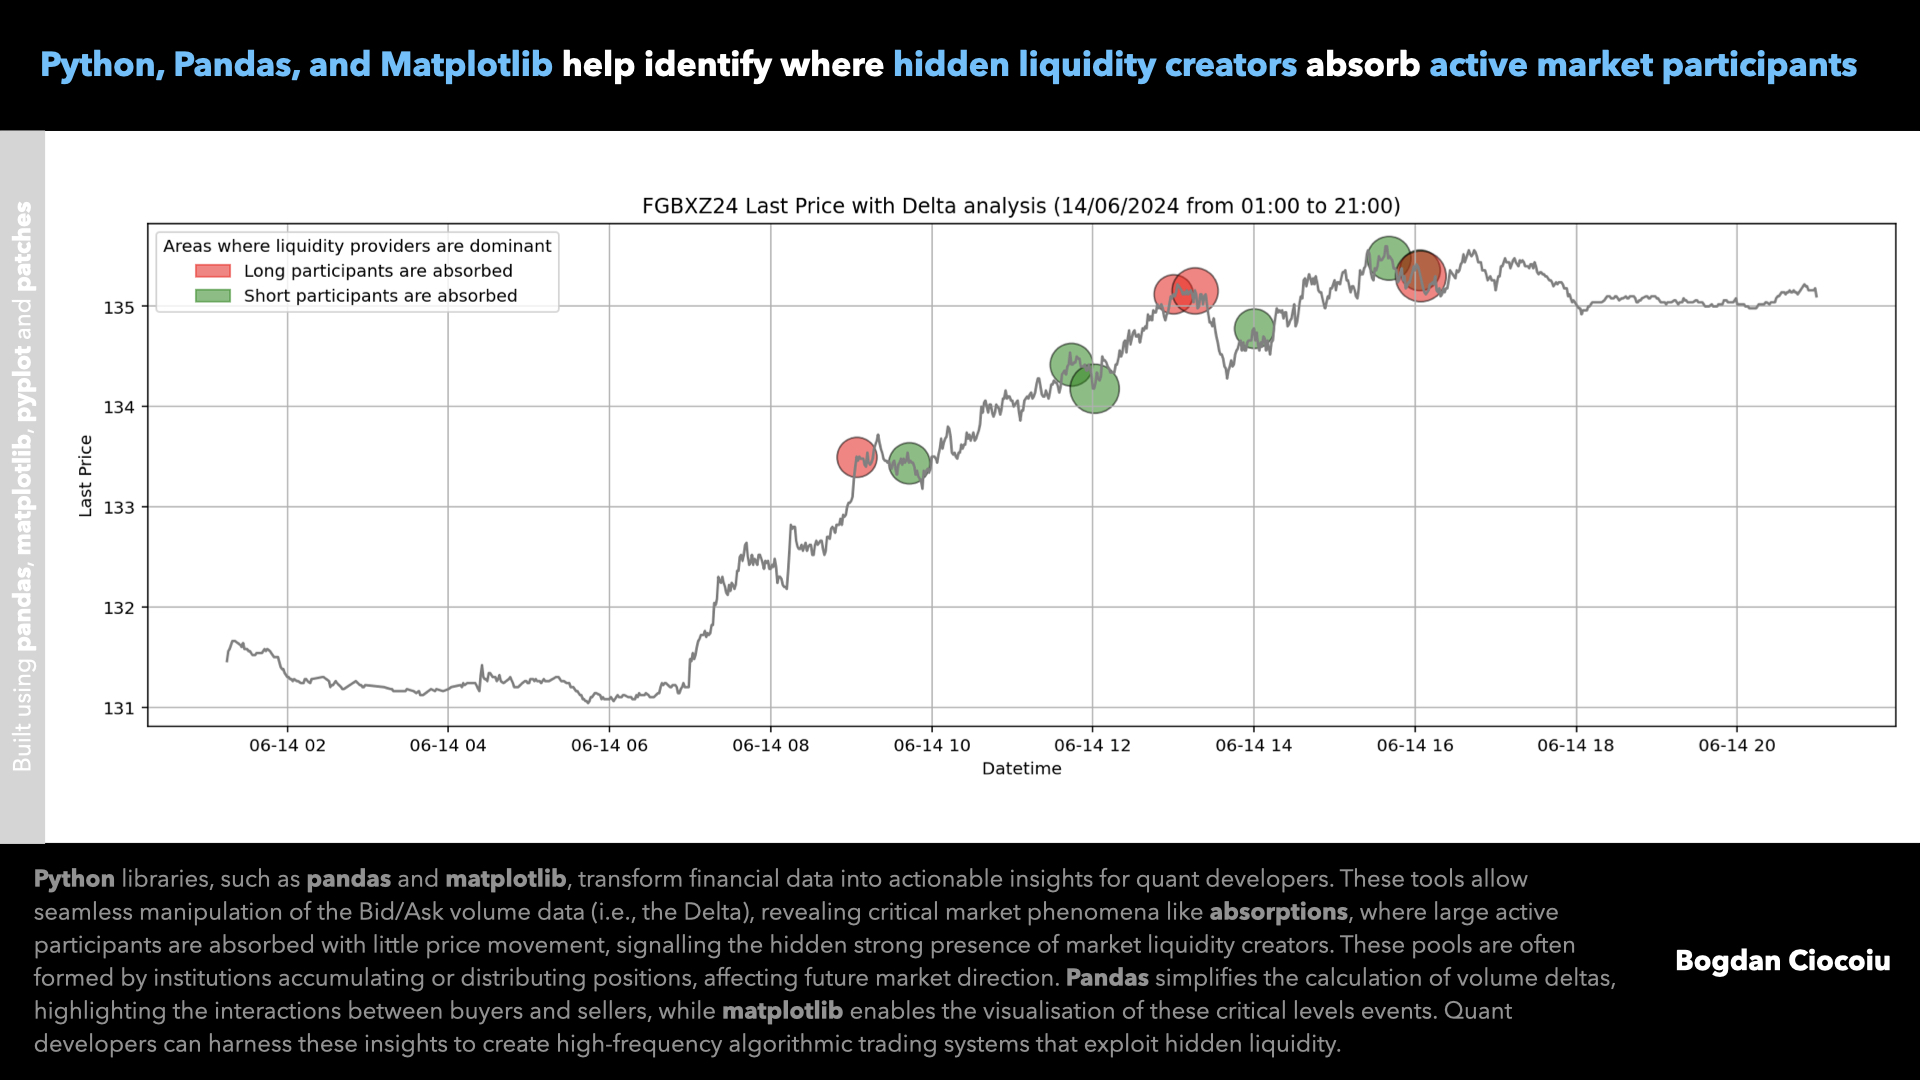
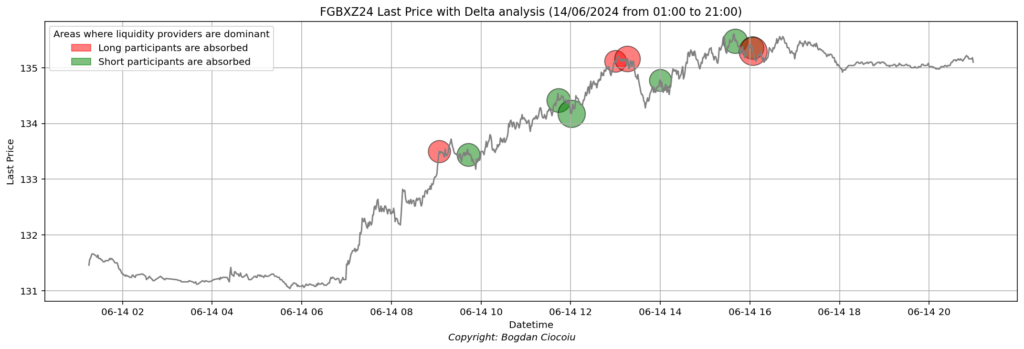
These operations are crucial for analysing market liquidity, in particular, absorptions of active market participants by passive liquidity providers. This analysis provides insight into whether buying or selling pressure dominates at any given time and whether there is a more significant opposite response from passive participants. By understanding this, developers can identify potential areas of interest where significant market activity might occur.
Matplotlib offers powerful visualisation capabilities. In financial markets, visualising trends, anomalies, and patterns in the data is critical for making informed decisions. Matplotlib allows developers to plot time series data, such as price movements, bid/ask spreads or delta volumes, in a way that highlights key levels of interest based on the interaction between passive and active market participants on either side of the order book.
For instance, plotting circles on a price chart to represent areas where the delta exceeds a threshold can provide an intuitive way of spotting absorptions. This approach often indicates that banks and financial institutions are accumulating or distributing positions at these levels.
These liquidity pools interest quantitative analysts, developers, and traders because they represent areas where large participants are trading, potentially influencing future market direction.
Using bid and ask volume data, quantitative analysts can examine the patterns of interactions between market participants. However, when adding Python, equipped with powerful libraries, including TA-Lib, developers can introduce automation and medium/high-frequency trading systems that can execute based on multiple confluences.
Python, combined with pandas and matplotlib, provides a powerful toolkit for analysing financial data feeds, especially when dealing with volumetric data. In an era where data-driven decisions are essential for success, leveraging Python is necessary for any quant developer looking to stand out in the financial industry.
Leave a Reply
You must be logged in to post a comment.