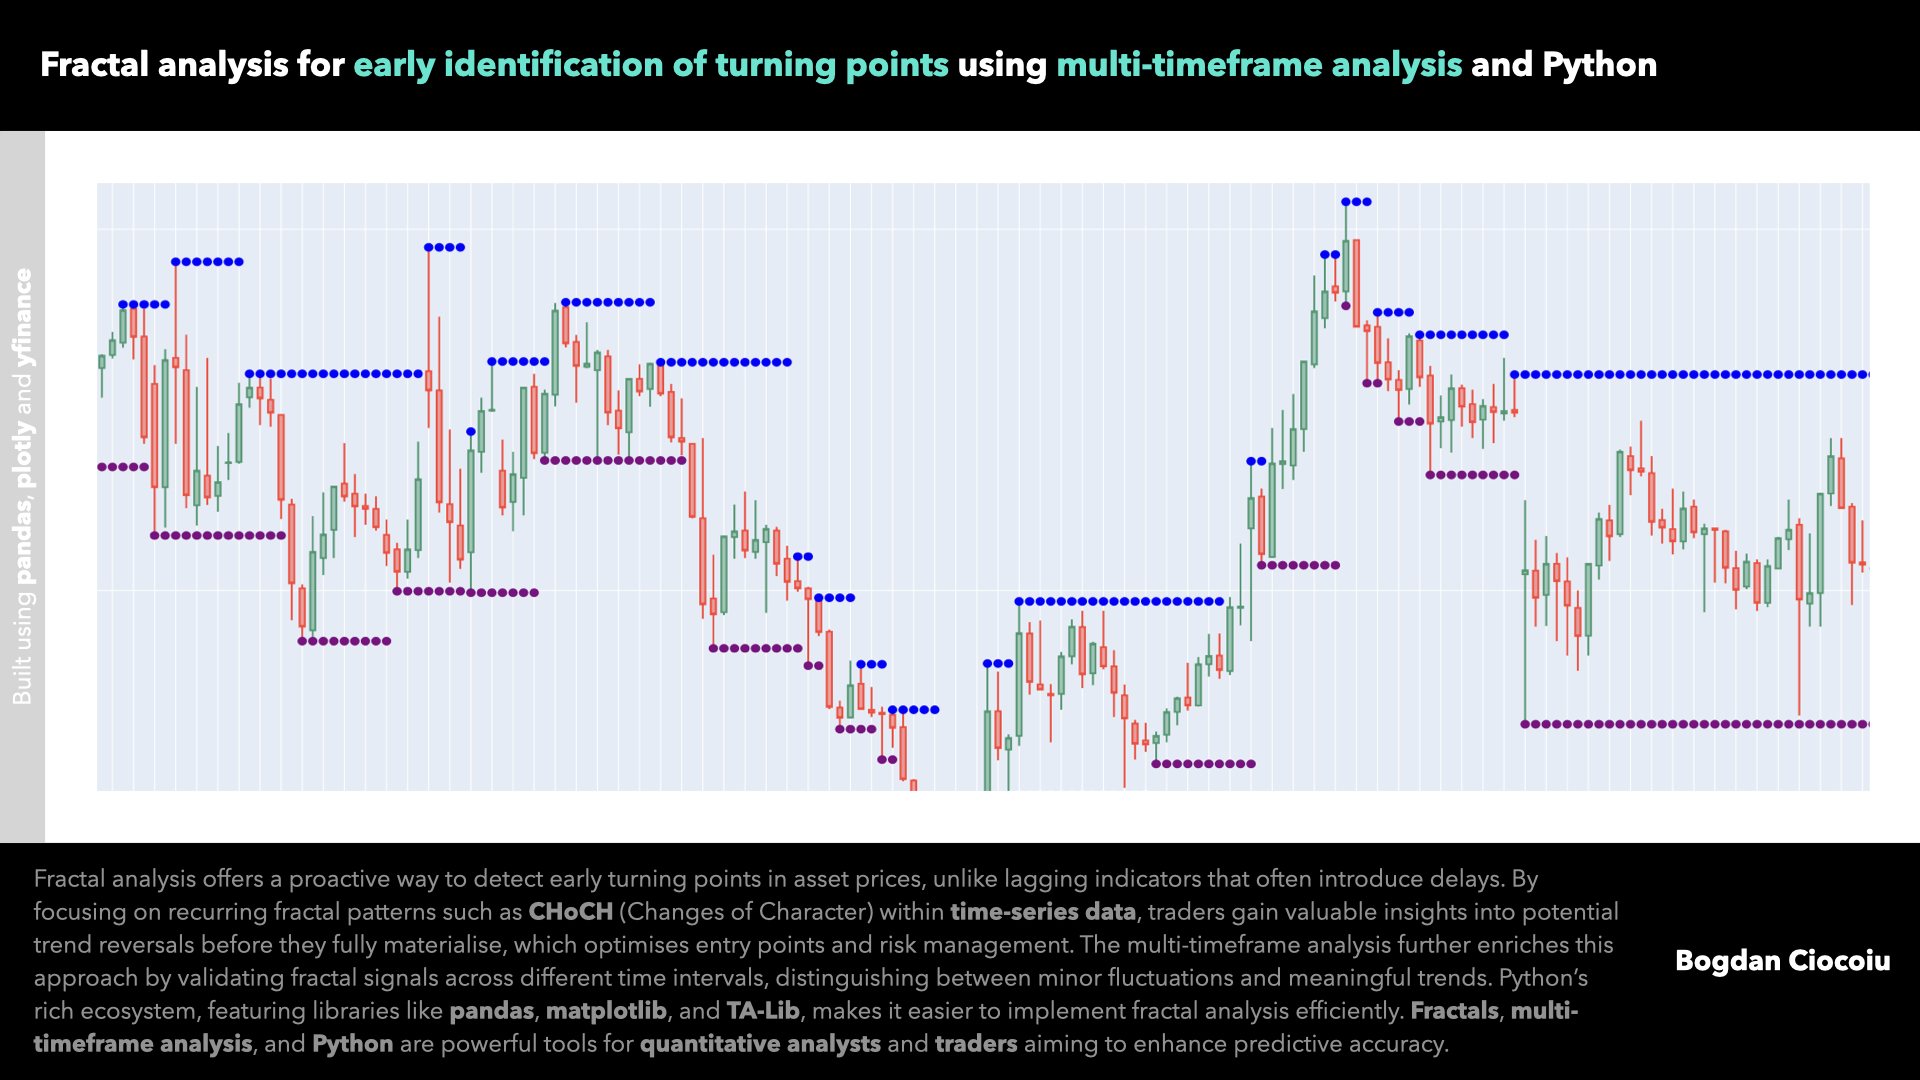
In financial markets, the ability to accurately and timely identify turning points in floating assets such as stocks, commodities, or forex pairs can spell the difference between profit and loss.
Fractal analysis, a technical approach focusing on repetitive patterns and structures within asset price movements, has become a powerful tool for recognising these turning points. Unlike traditional lagging indicators, which often introduce latency and delay the confirmation of trends, fractal analysis provides early insights into the cyclical movements of prices, enhancing the trader’s ability to capitalise on upcoming reversals.
I will explore the importance of early fractal identification, the advantage of multi-time frame analysis, and how Python’s libraries make fractal analysis more accessible for quantitative analysts.
Early identification
One of the core challenges traders and analysts face is the latency introduced by conventional technical indicators such as moving averages, oscillators, and trend-following indicators. These tools confirm price movements only after they have occurred, creating a delay that can lead to missed opportunities or suboptimal entry and exit points.
Fractal analysis, on the other hand, seeks to identify self-similar patterns within price data. Analysts can detect fractal structures that often precede trend reversals by observing price action on a granular level.
Identifying these fractal CHoCHs (“Changes of Character”) early allows traders to anticipate market movements and react before larger trends become apparent to the broader market. This proactive approach enables tighter stop losses, earlier entries, and greater profits. Instead of responding to confirmed signals with lagging indicators, analysts can leverage fractals to interpret potential reversal points before they occur. Consequently, fractal analysis sharpens predictive accuracy and optimises risk management.
Multi-timeframe analysis
Fractals occur across different timeframes, which provides unique opportunities for multi-timeframe analysis.
- By examining fractal patterns across various time intervals, traders gain a more comprehensive understanding of an asset’s overall structure. For instance, a fractal pattern emerging on a 5-minute chart may indicate a short-term reversal, while similar patterns observed on a daily chart may signify a more significant, long-term trend change.
- Drilling down from a daily, hourly, and 5-minute timeframe may enable a trader to find the first market behaviours that indicate a CHoCH (“Change of Character”) is likely to happen in a higher time frame and set tight pending orders with competitive risk-reward ratios.
- Multi-timeframe analysis allows for a layered, holistic view of price behaviour and helps align trades with the dominant trend. This approach mitigates the risk of “false signals” by validating fractal patterns across different scales. We call these market confluences. For example, a buy signal on a shorter timeframe gains validity if it aligns with a bullish fractal pattern on a higher timeframe, such as the daily or weekly chart.
Mastering multi-timeframe analysis provides a strategic edge, enabling traders to distinguish between short-lived price fluctuations and genuine reversals.
Python for fractal analysis
Python’s flexibility and accessibility make it an invaluable tool for financial analysis. Through libraries such as pandas for data manipulation, NumPy for numerical computations, and matplotlib or plotly for data visualisation, Python offers a powerful framework for implementing fractal analysis. Libraries like TA-Lib provide access to built-in technical indicators, while custom fractal functions can be coded to detect fractal patterns across timeframes.
For example, using pandas, one can efficiently handle time-series data, calculate highs and lows, and apply conditional checks to identify fractal highs and lows. Combining matplotlib with plotly enables interactive visualisation of fractal structures, making it easier to pinpoint entry and exit points in real time. For those seeking to integrate fractal analysis into machine learning models, scikit-learn is a suitable library to experiment with predictive techniques based on identified fractal patterns.
Python’s ecosystem facilitates robust, reproducible, and highly customisable fractal analysis workflows that meet the demands of quantitative finance.


Leave a Reply
You must be logged in to post a comment.