Machine learning has become an indispensable tool for tackling complex problems in quantitative analysis. Among the arsenal of algorithms, Support Vector Machines (SVM) stand out for their robustness in classification and regression tasks. With powerful libraries like sklearn and Matplotlib, Python empowers quant developers to build, evaluate, and visualise SVM models efficiently, driving impactful results in financial and analytical contexts.
Binary classification
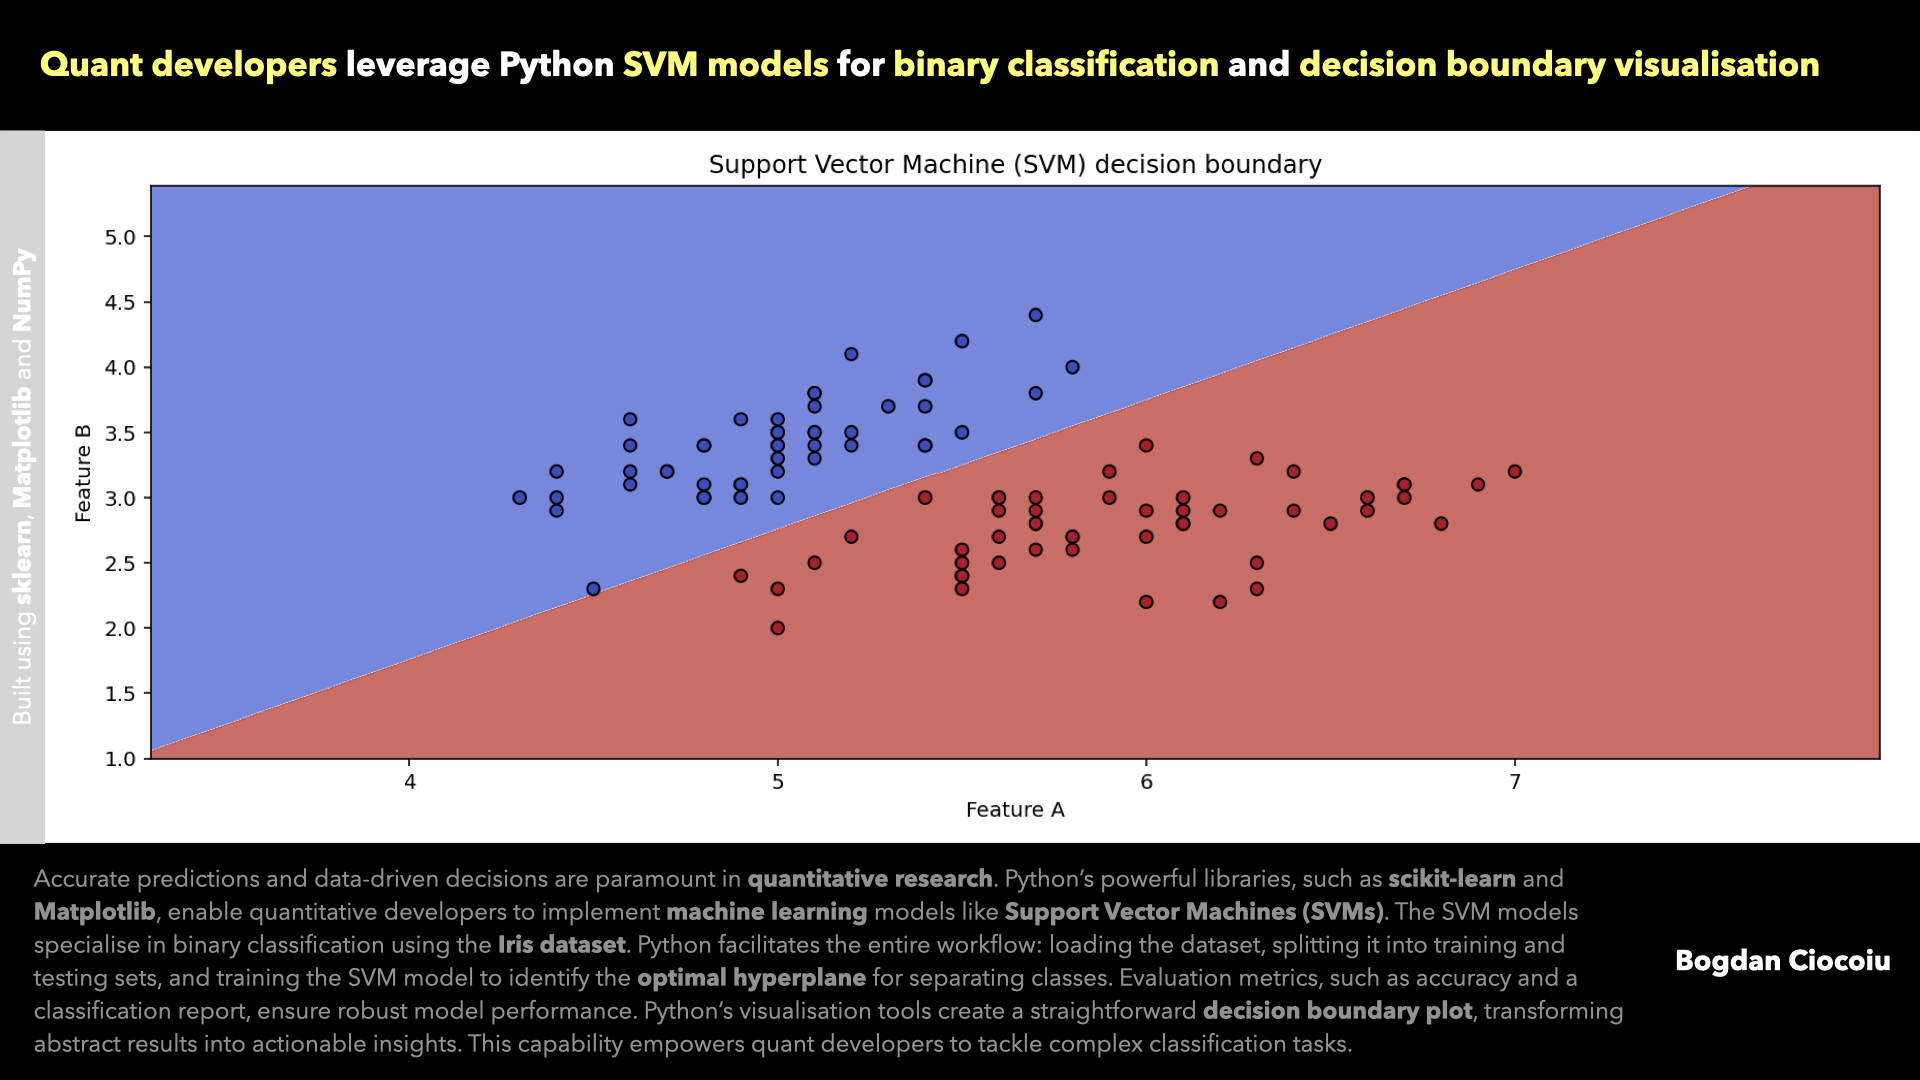
Support Vector Machine models identify the optimal hyperplane that separates data into distinct classes. By maximising the margin between classes, SVM ensures a clear and precise classification, making it a go-to model for binary classification tasks. Python can classify the Iris dataset into two classes using SVM with a linear kernel.
The workflow begins with data preparation. By focusing on two features and classes, we simplify the dataset for effective visualisation. Using Python’s train_test_split function, the data is split into training and testing subsets, ensuring the model is trained and validated on distinct data points.
Python’s sklearn library makes implementing SVM straightforward. The SVC class allows developers to easily configure the model, choosing parameters such as the kernel type, regularisation strength, and random state for reproducibility. After completing the model training, it evaluates the data using robust metrics such as accuracy and a classification report, ensuring the results meet the desired performance standards.
This efficiency extends to scalability. While this example uses a small dataset, Python’s architecture supports scaling to vast datasets, making it ideal for real-world financial applications such as predicting stock trends, analysing customer segmentation, or identifying anomalies in trading data.
Stakeholder communication
A significant advantage of Python lies in its visualisation capabilities. The example includes a function to plot the decision boundary created by the SVM model. By overlaying the boundary on the dataset, quant developers gain a tangible understanding of the model’s performance and ability to separate classes.
This visualisation is not merely for internal validation; it plays a critical role in communicating insights to stakeholders. For instance, visualisations in financial markets help bridge the gap between complex quantitative models and actionable business decisions, ensuring clarity and buy-in from non-technical audiences.

Real-world applications
The utility of SVM extends far beyond academic examples. Quant developers can use SVM to tackle problems like:
- Predicting market trends by analysing economic indicators and stock performance data.
- Classifying transactions as fraudulent or legitimate based on historical data.
- Identifying distinct customer groups for targeted marketing
Python’s ecosystem is the backbone of these solutions. Libraries like sklearn streamline the development of SVM models, while tools like Matplotlib enable comprehensive analysis and presentation of results.
Quantitative developers leveraging Python for SVM-based solutions not only streamline their workflows but also unlock the potential to deliver highly accurate, actionable insights. This capability solidifies Python’s position as an indispensable tool for solving complex quantitative finance challenges.
Python’s integration with SVM models exemplifies how technology bridges theoretical models with practical applications. Quant developers with Python’s tools can optimise strategies, refine predictions, and drive impactful decisions in the financial markets and beyond.


Leave a Reply
You must be logged in to post a comment.