
matplotlib
-
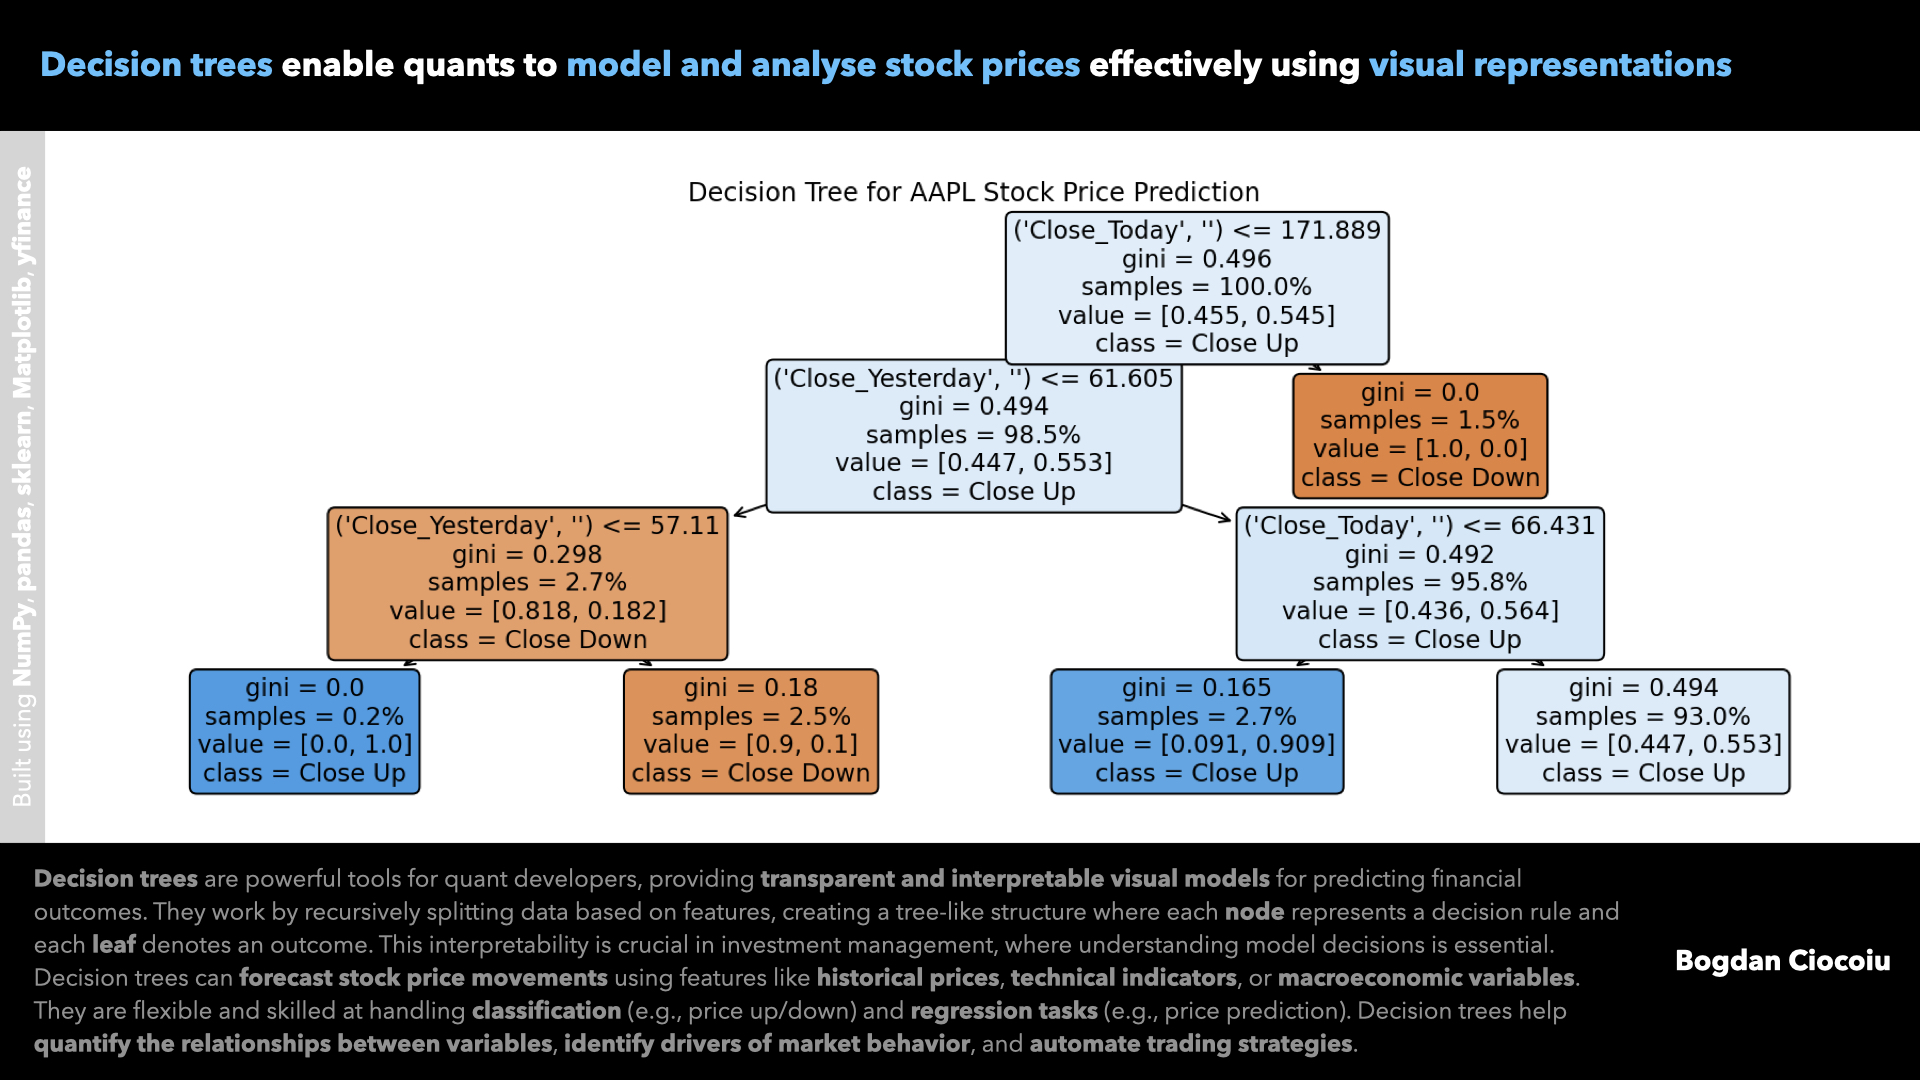
Supervised machine learning – Decision trees
Quantitative developers are pivotal in leveraging data to make informed investment decisions. Among the array of analytical tools available, decision trees are a powerful, interpretable, and versatile method for solving financial problems. Their ability to model decisions based on structured…
-
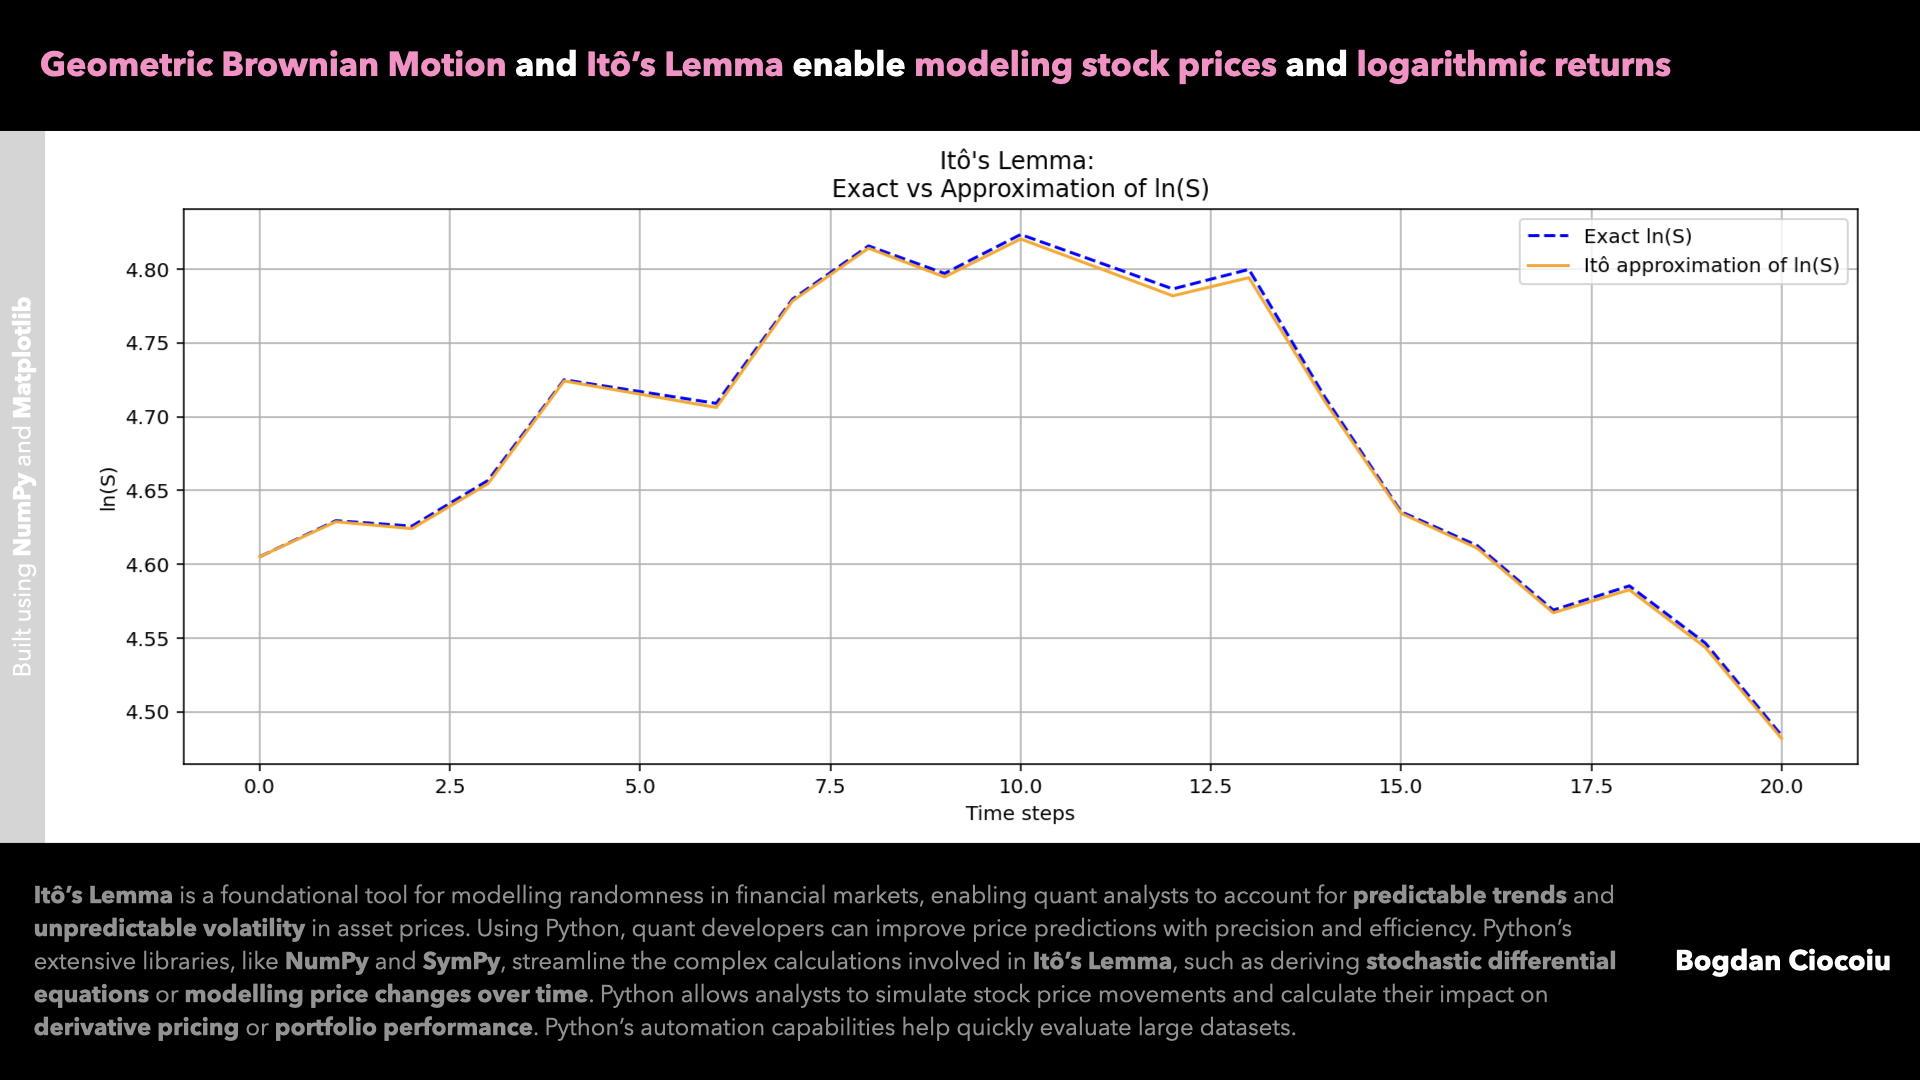
Price modelling – Itô’s Lemma – Geometric Brownian Motion
Quantitative analysts constantly seek robust methods to model and predict asset price movements. One such powerful tool is Itô’s Lemma, a cornerstone of stochastic calculus. By leveraging this mathematical framework alongside Python, quants can enhance their analytical toolkit, making strides in…
-
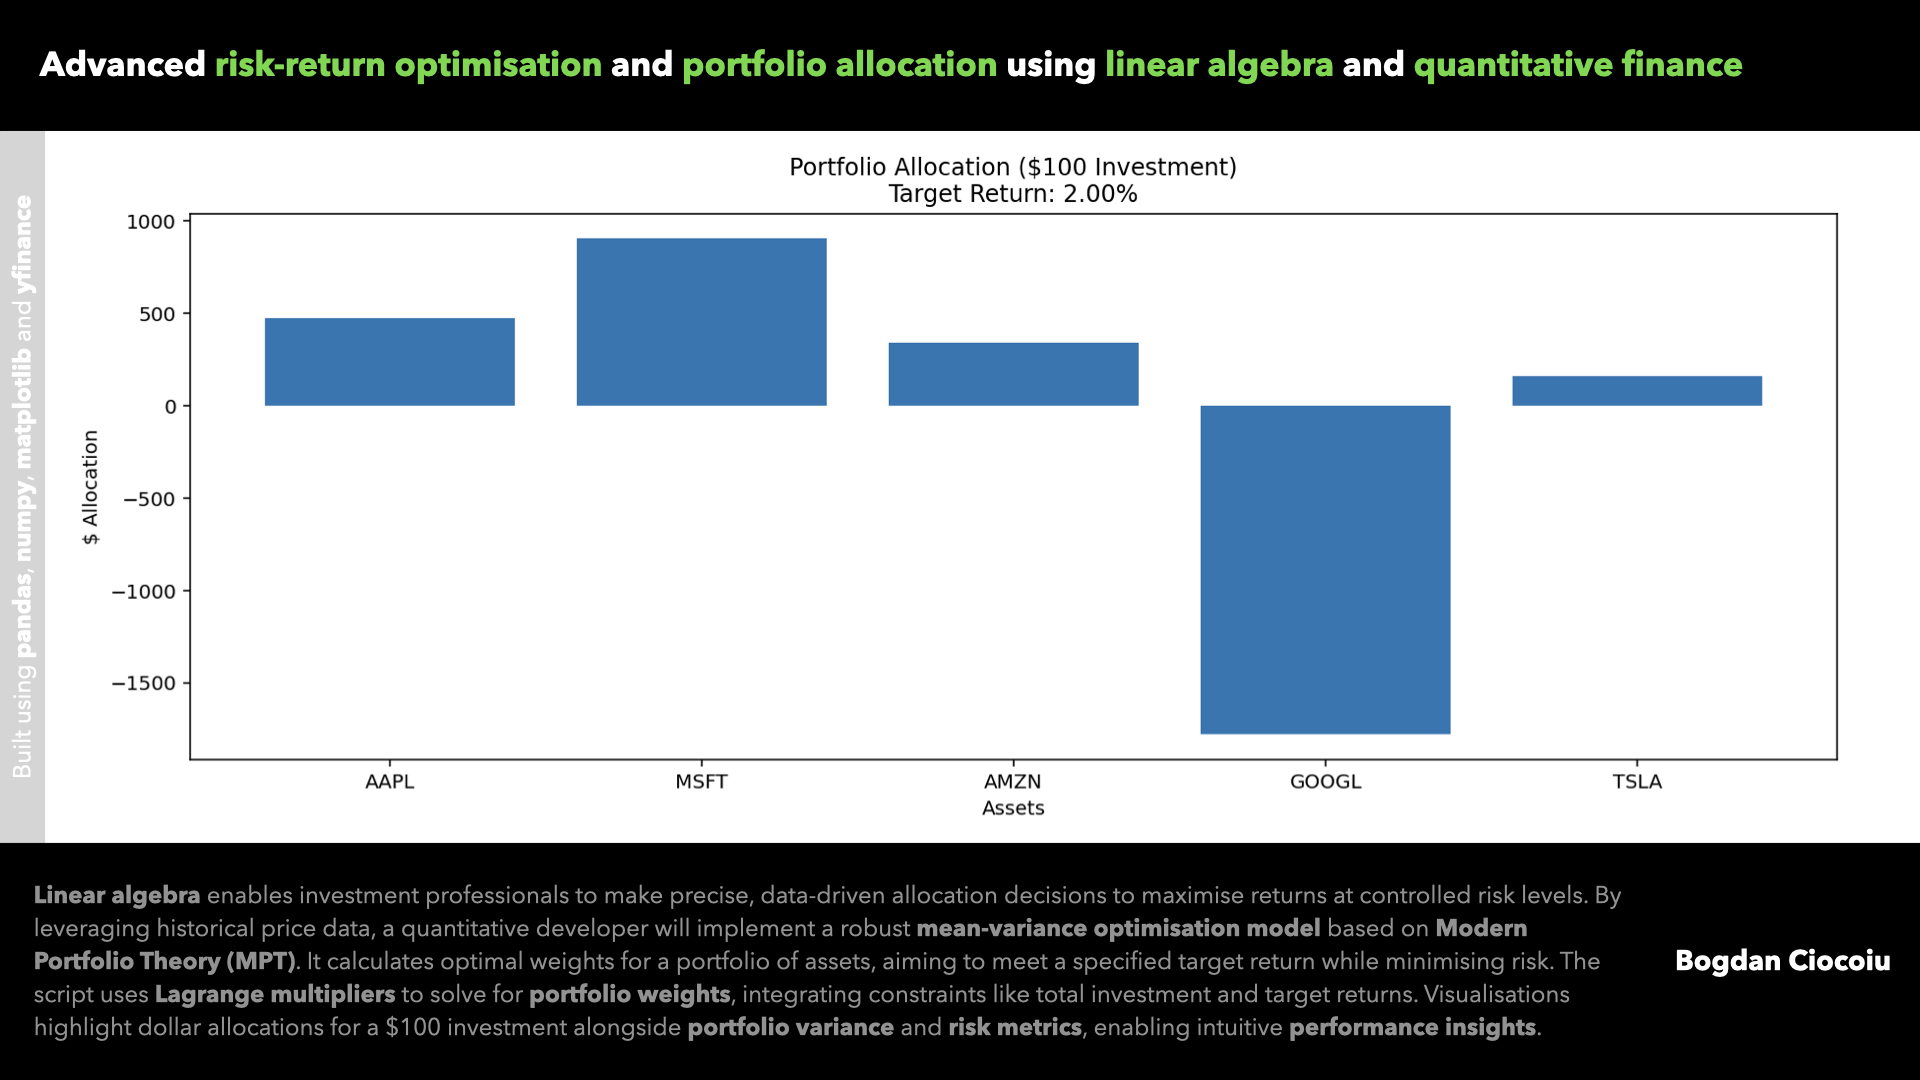
Portfolio optimisation – Linear algebra
Making investment decisions based on intuition or limited data can often lead to suboptimal outcomes. Quantitative analysis revolutionises how investors and portfolio managers approach asset allocation, enabling precise, data-backed strategies that optimise returns while controlling risks. One example of this…
-
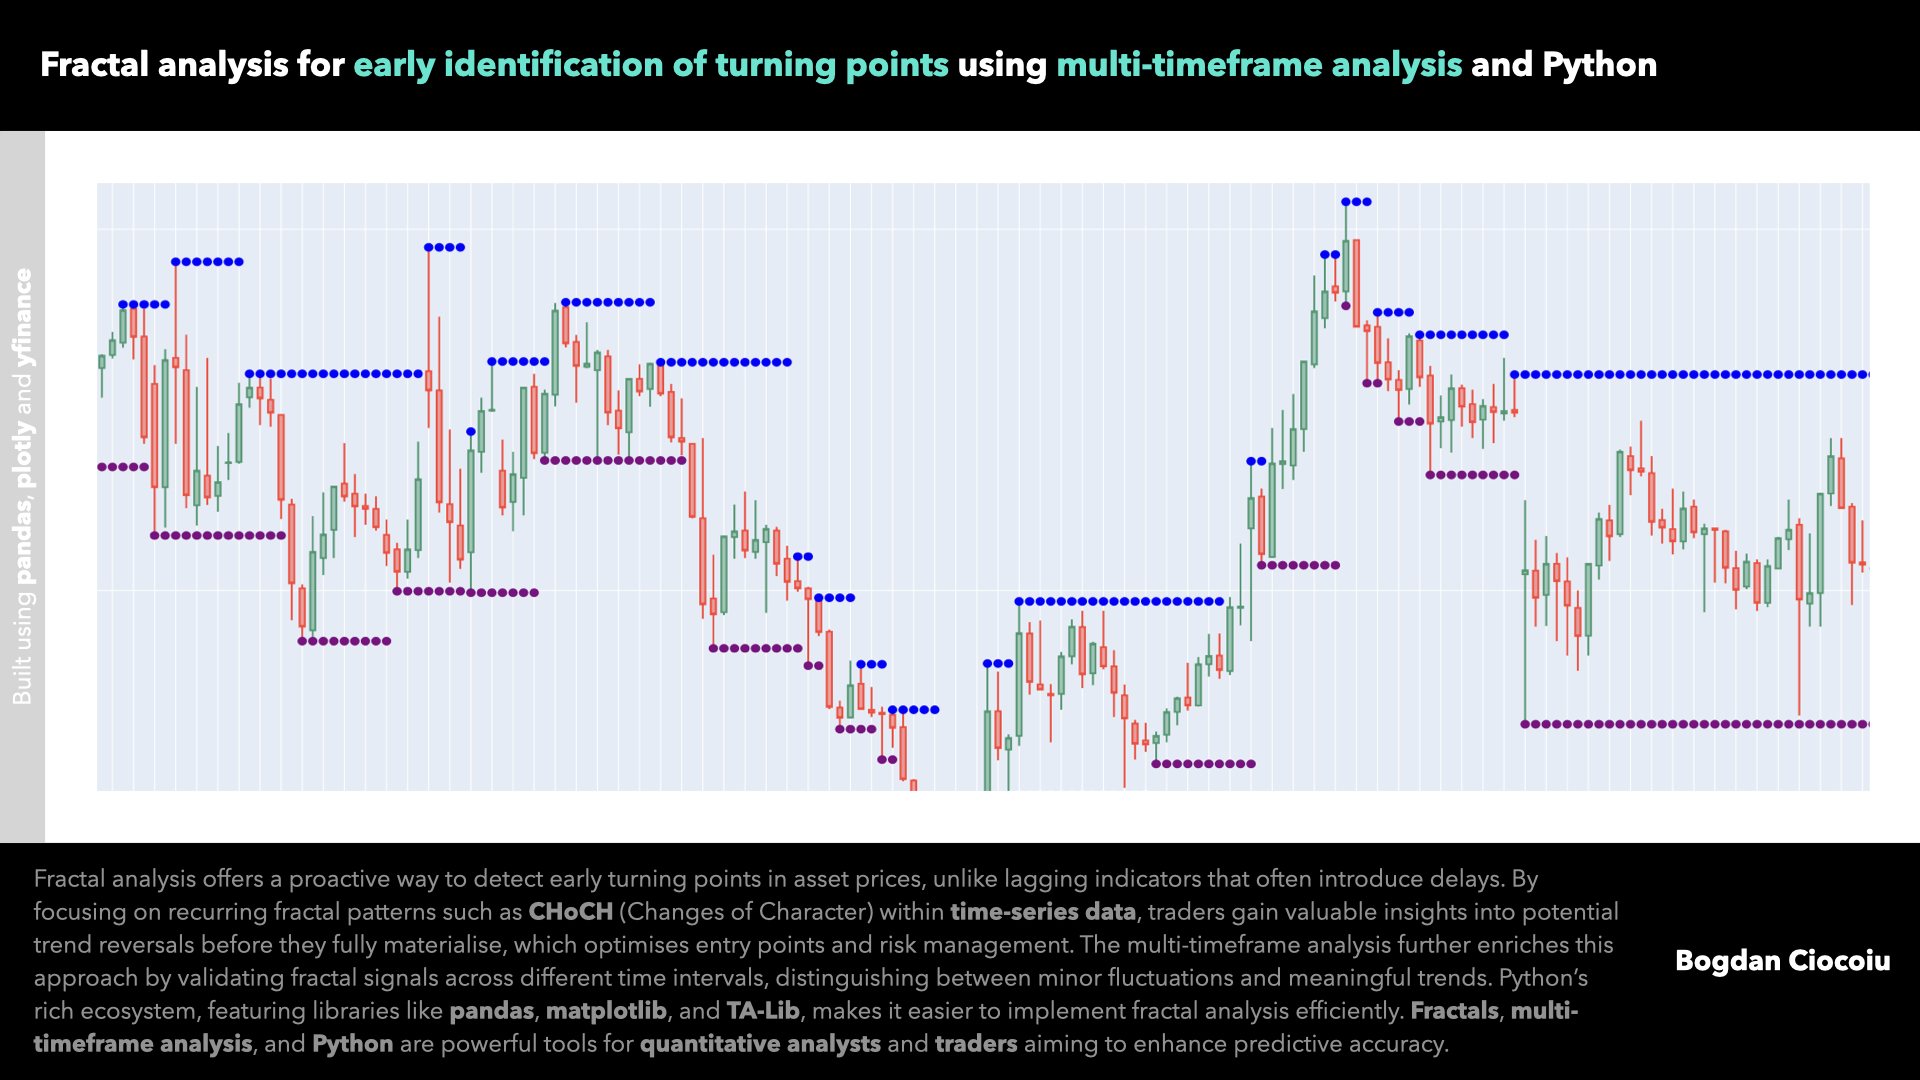
Market structure – Fractal microstructures
In financial markets, the ability to accurately and timely identify turning points in floating assets such as stocks, commodities, or forex pairs can spell the difference between profit and loss. Fractal analysis, a technical approach focusing on repetitive patterns and…
-
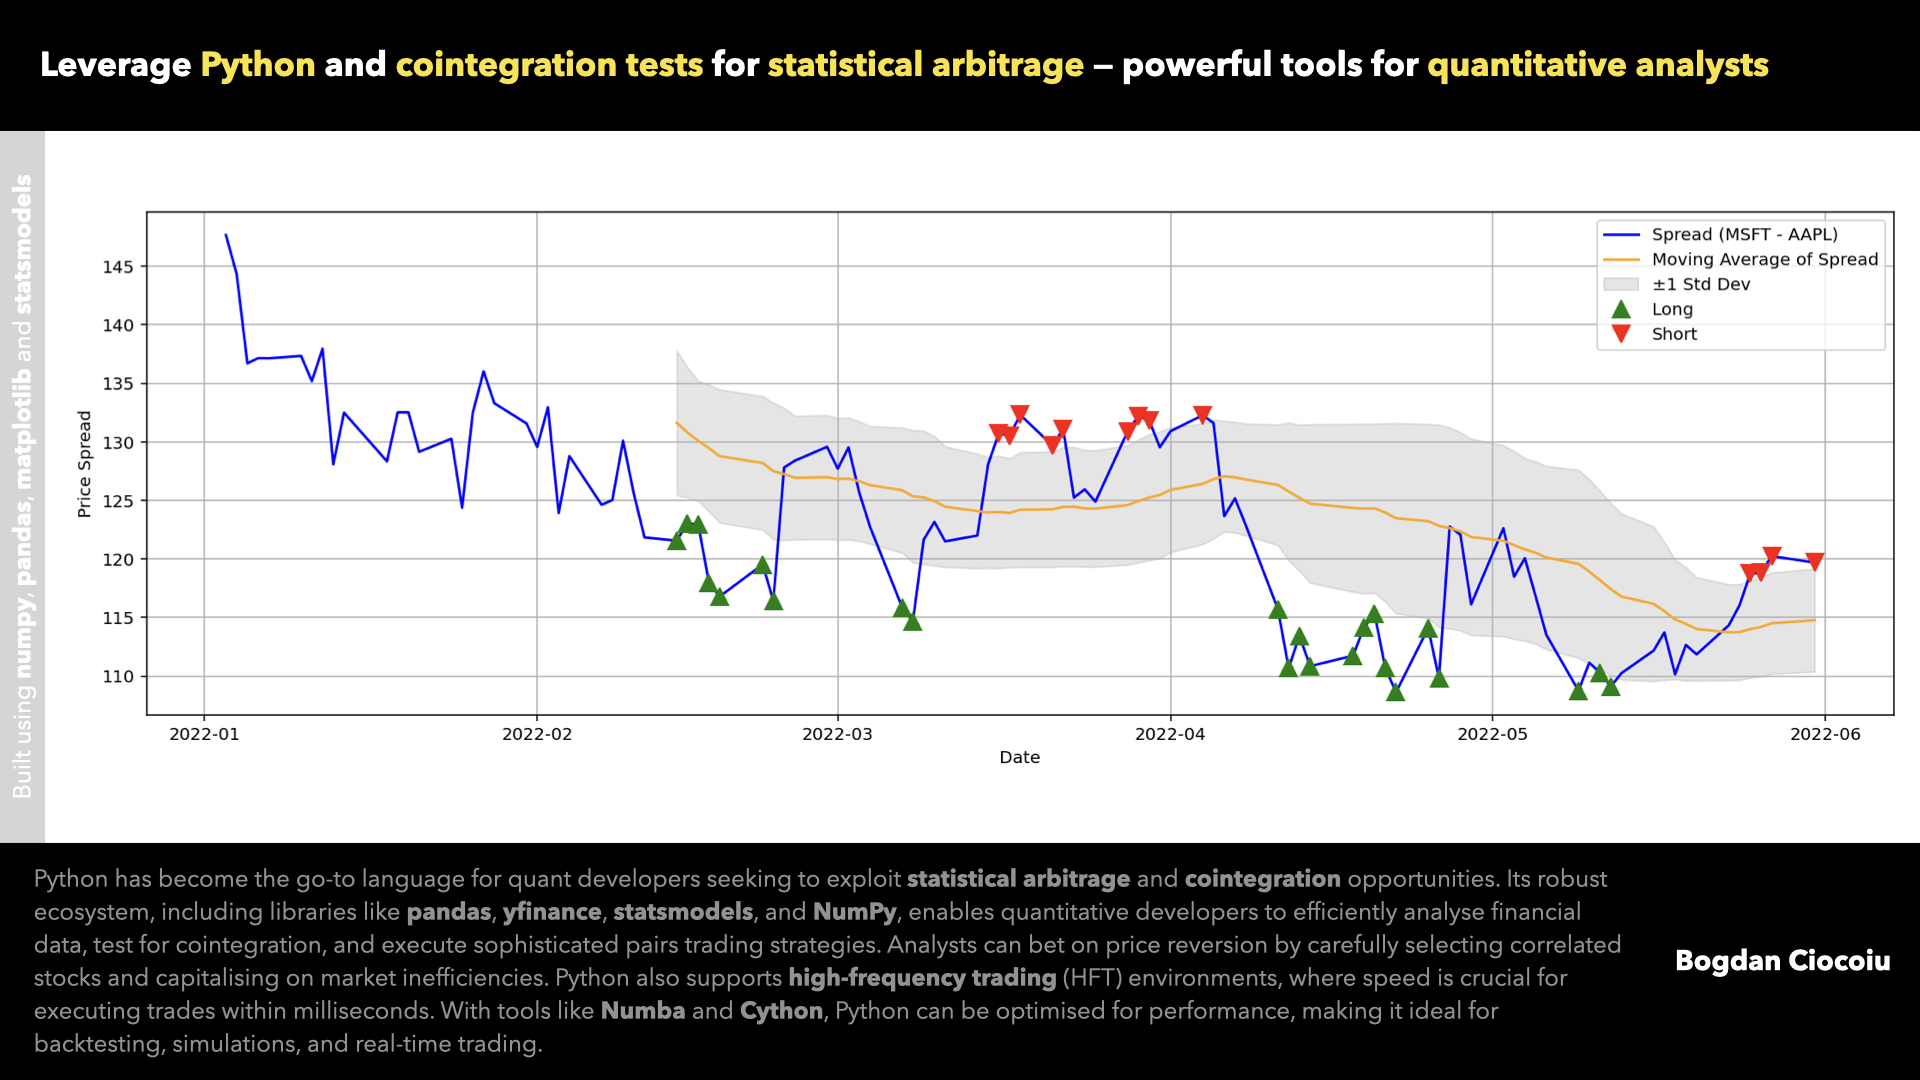
Statistical arbitrage – Cointegration – Pairs
Statistical arbitrage (or stat-arb) has become a powerful strategy for quantitative traders to exploit price discrepancies between financial instruments. By harnessing Python’s robust data analysis and statistical libraries, quantitative developers can implement sophisticated trading strategies, including pairs trading, to find and profit from…
-
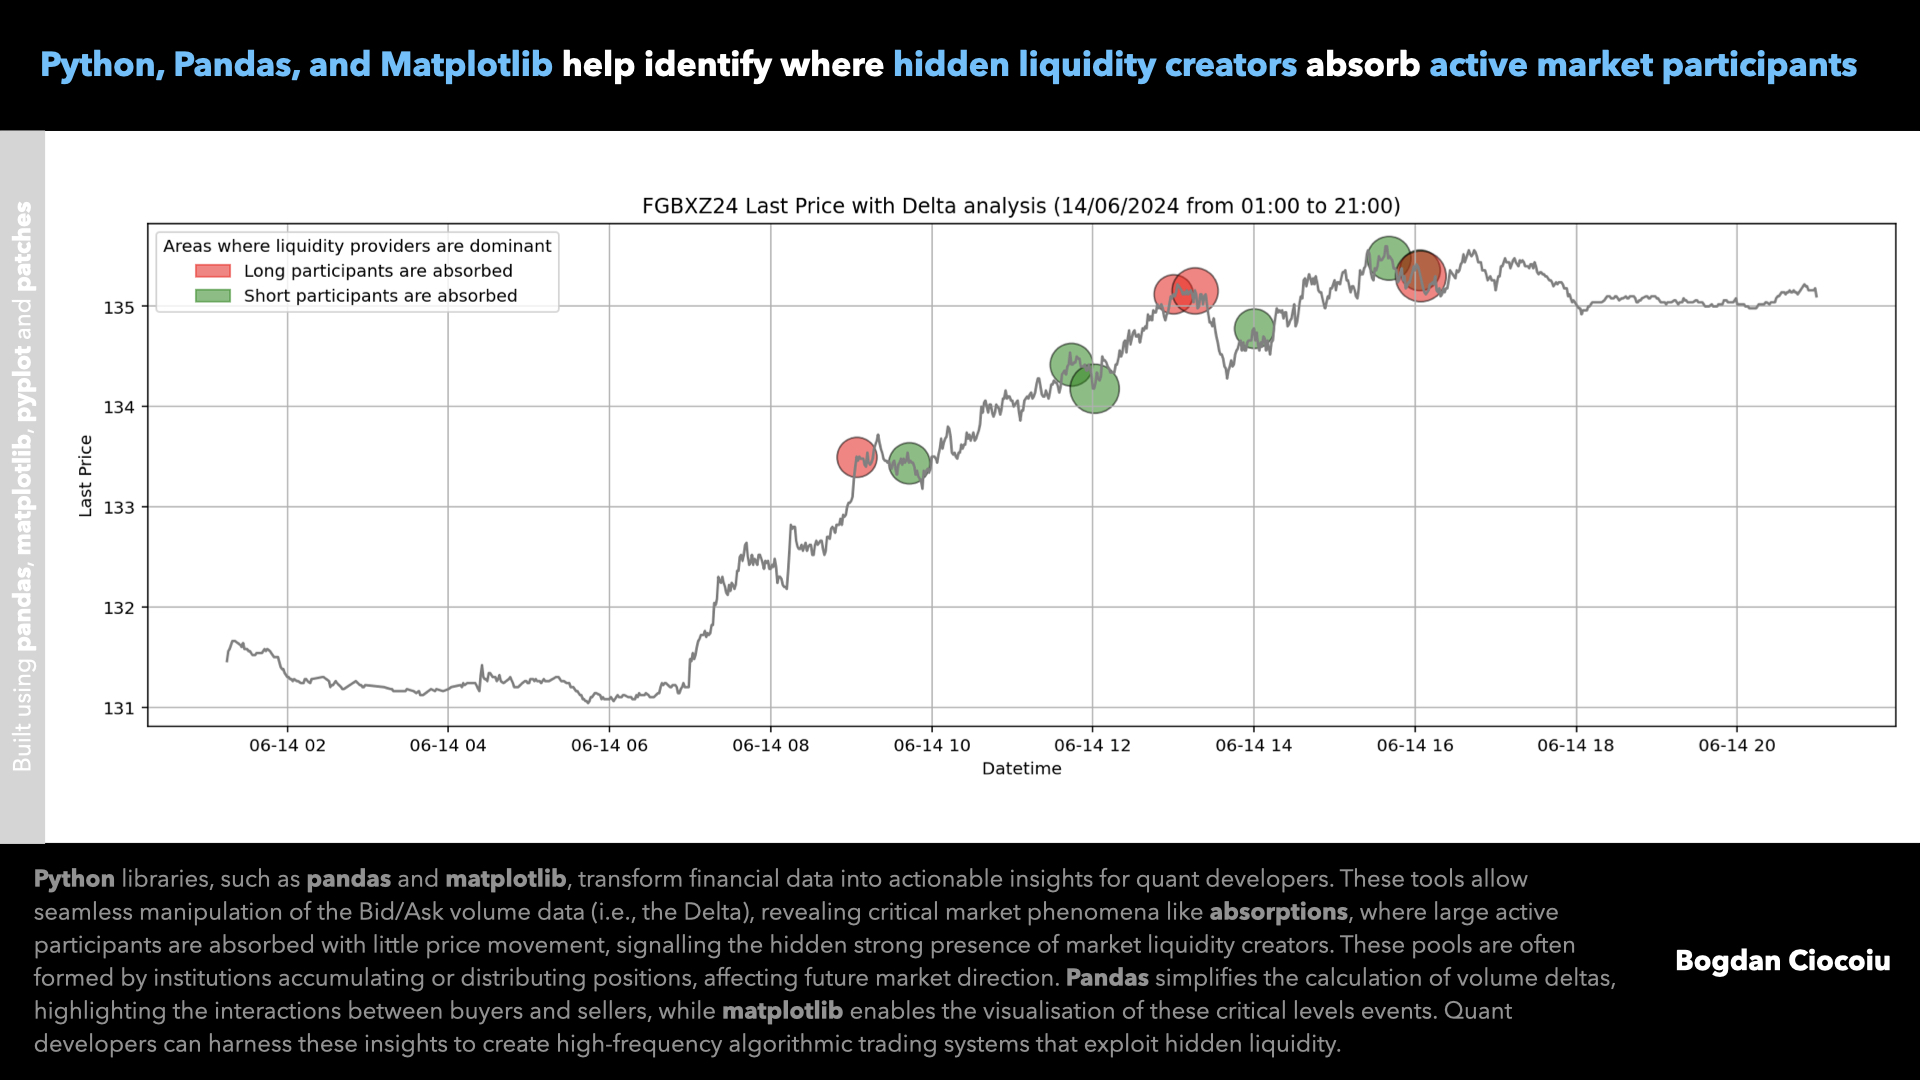
Absorptions
Leveraging Python and its powerful libraries like pandas and matplotlib provides a significant advantage in analysing financial data, especially when interpreting data feeds from centralised exchanges that include bid and ask data. The pandas library is paramount for managing and manipulating structured data in financial markets. A centralised…
-
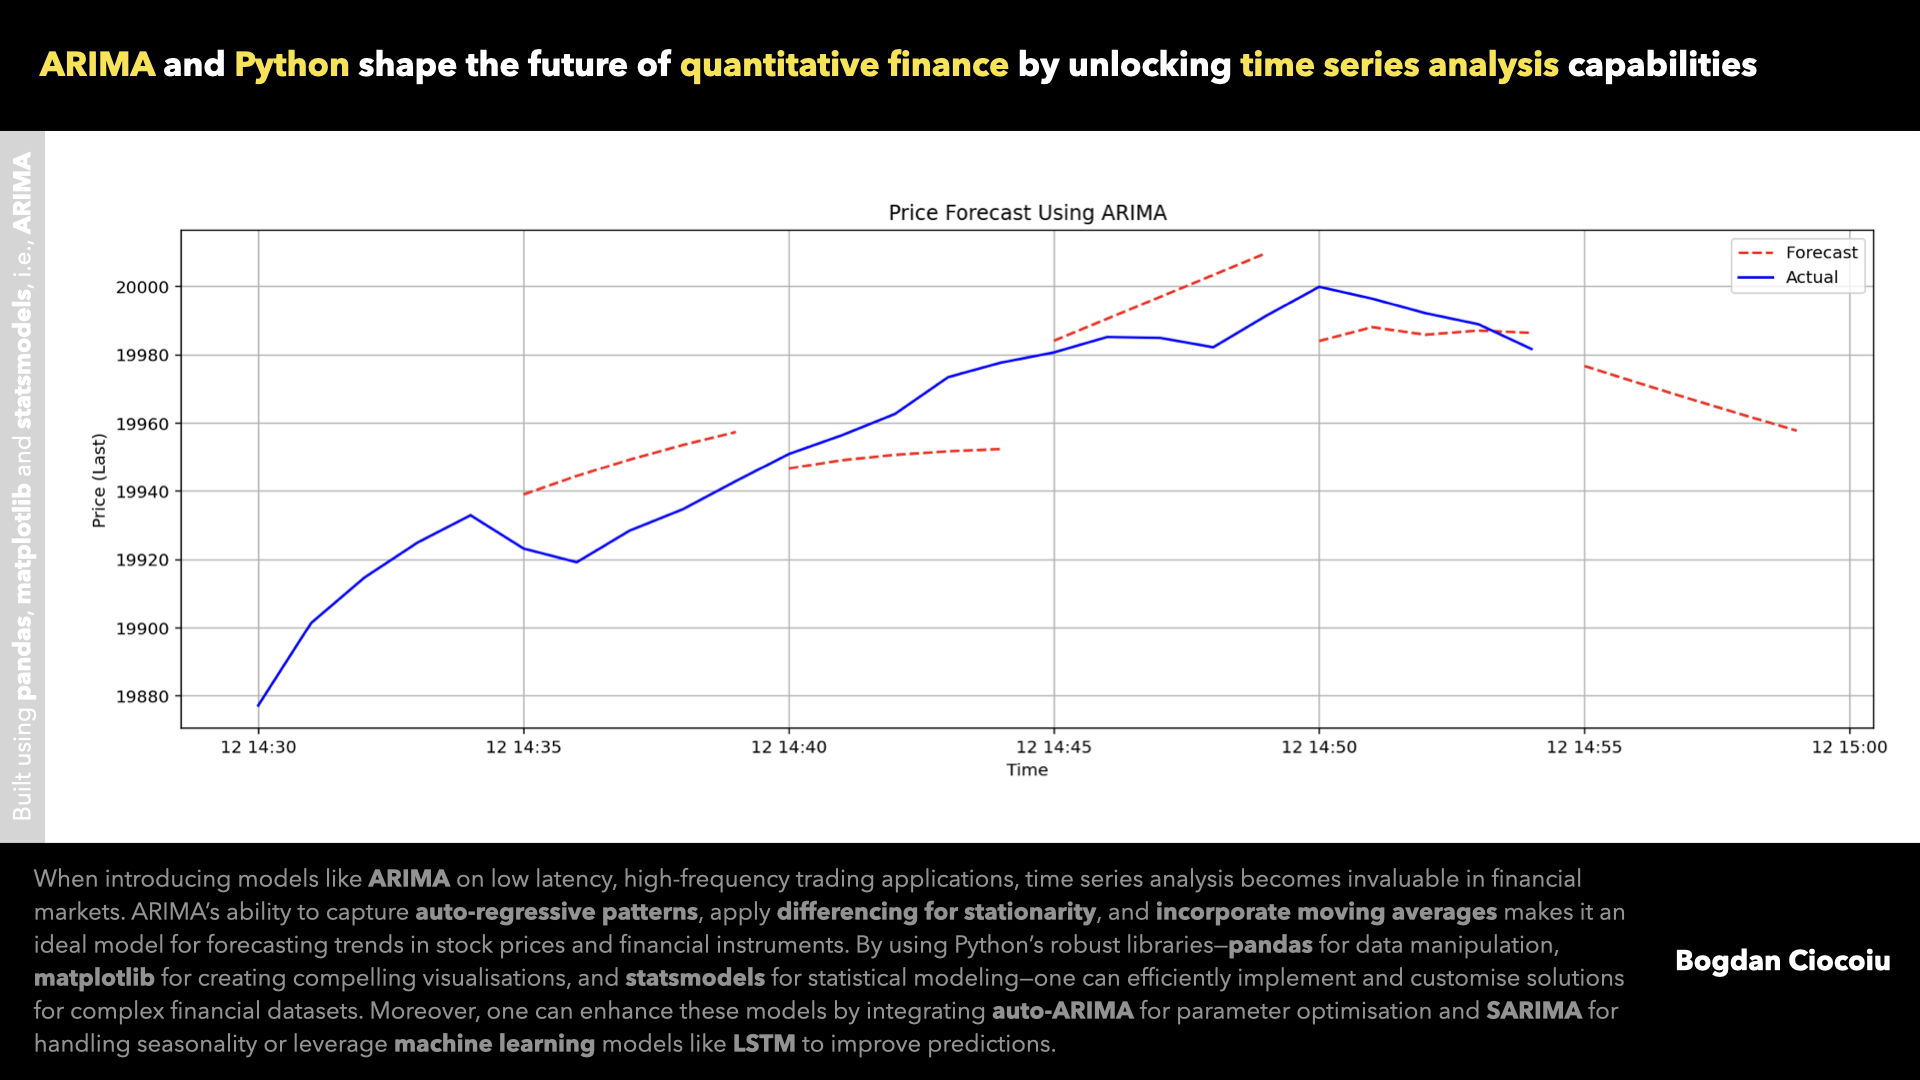
Time series analysis
Understanding time series data is crucial for making informed investment decisions in financial markets and the quantum analysis space. Time series analysis allows financial professionals to model and forecast market movements, identify trends, and detect underlying patterns in asset prices,…
-
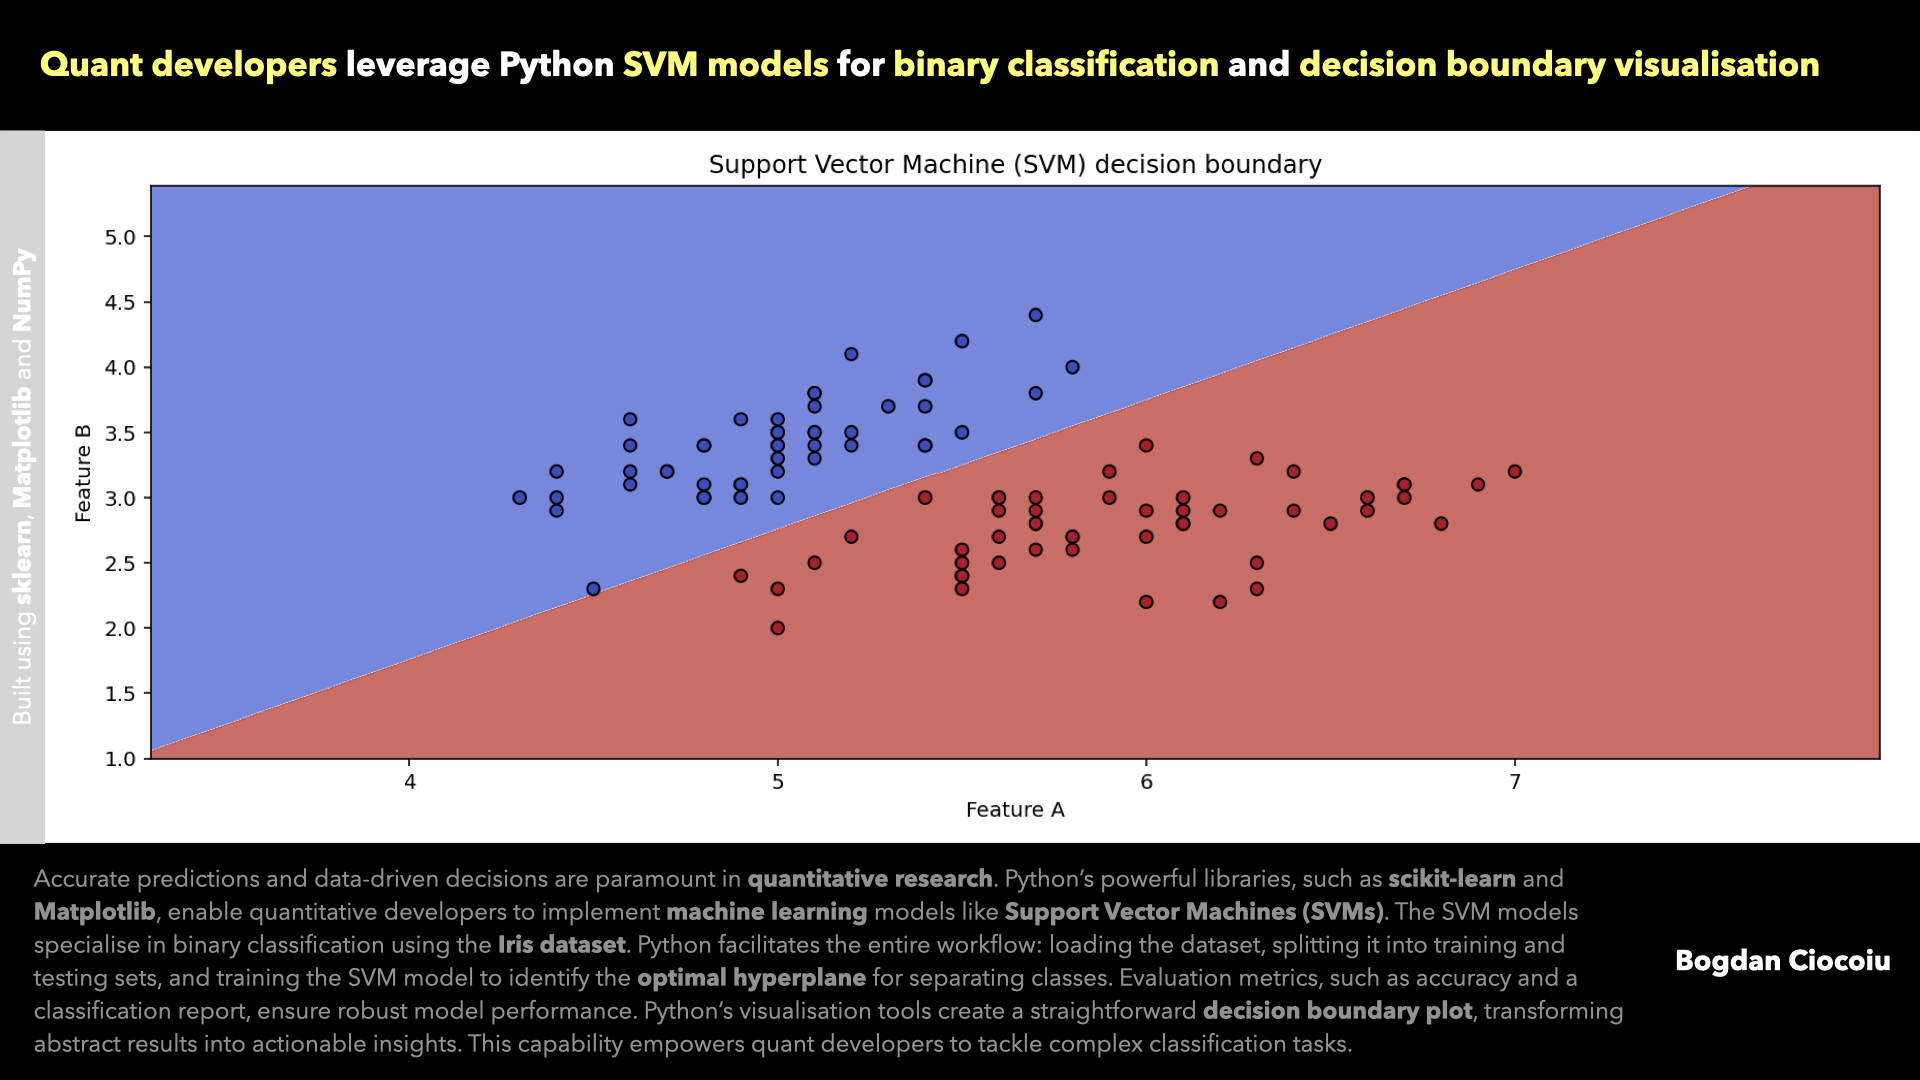
Supervised machine learning – Support vector machine
Machine learning has become an indispensable tool for tackling complex problems in quantitative analysis. Among the arsenal of algorithms, Support Vector Machines (SVM) stand out for their robustness in classification and regression tasks. With powerful libraries like sklearn and Matplotlib, Python empowers quant developers to build, evaluate,…
-
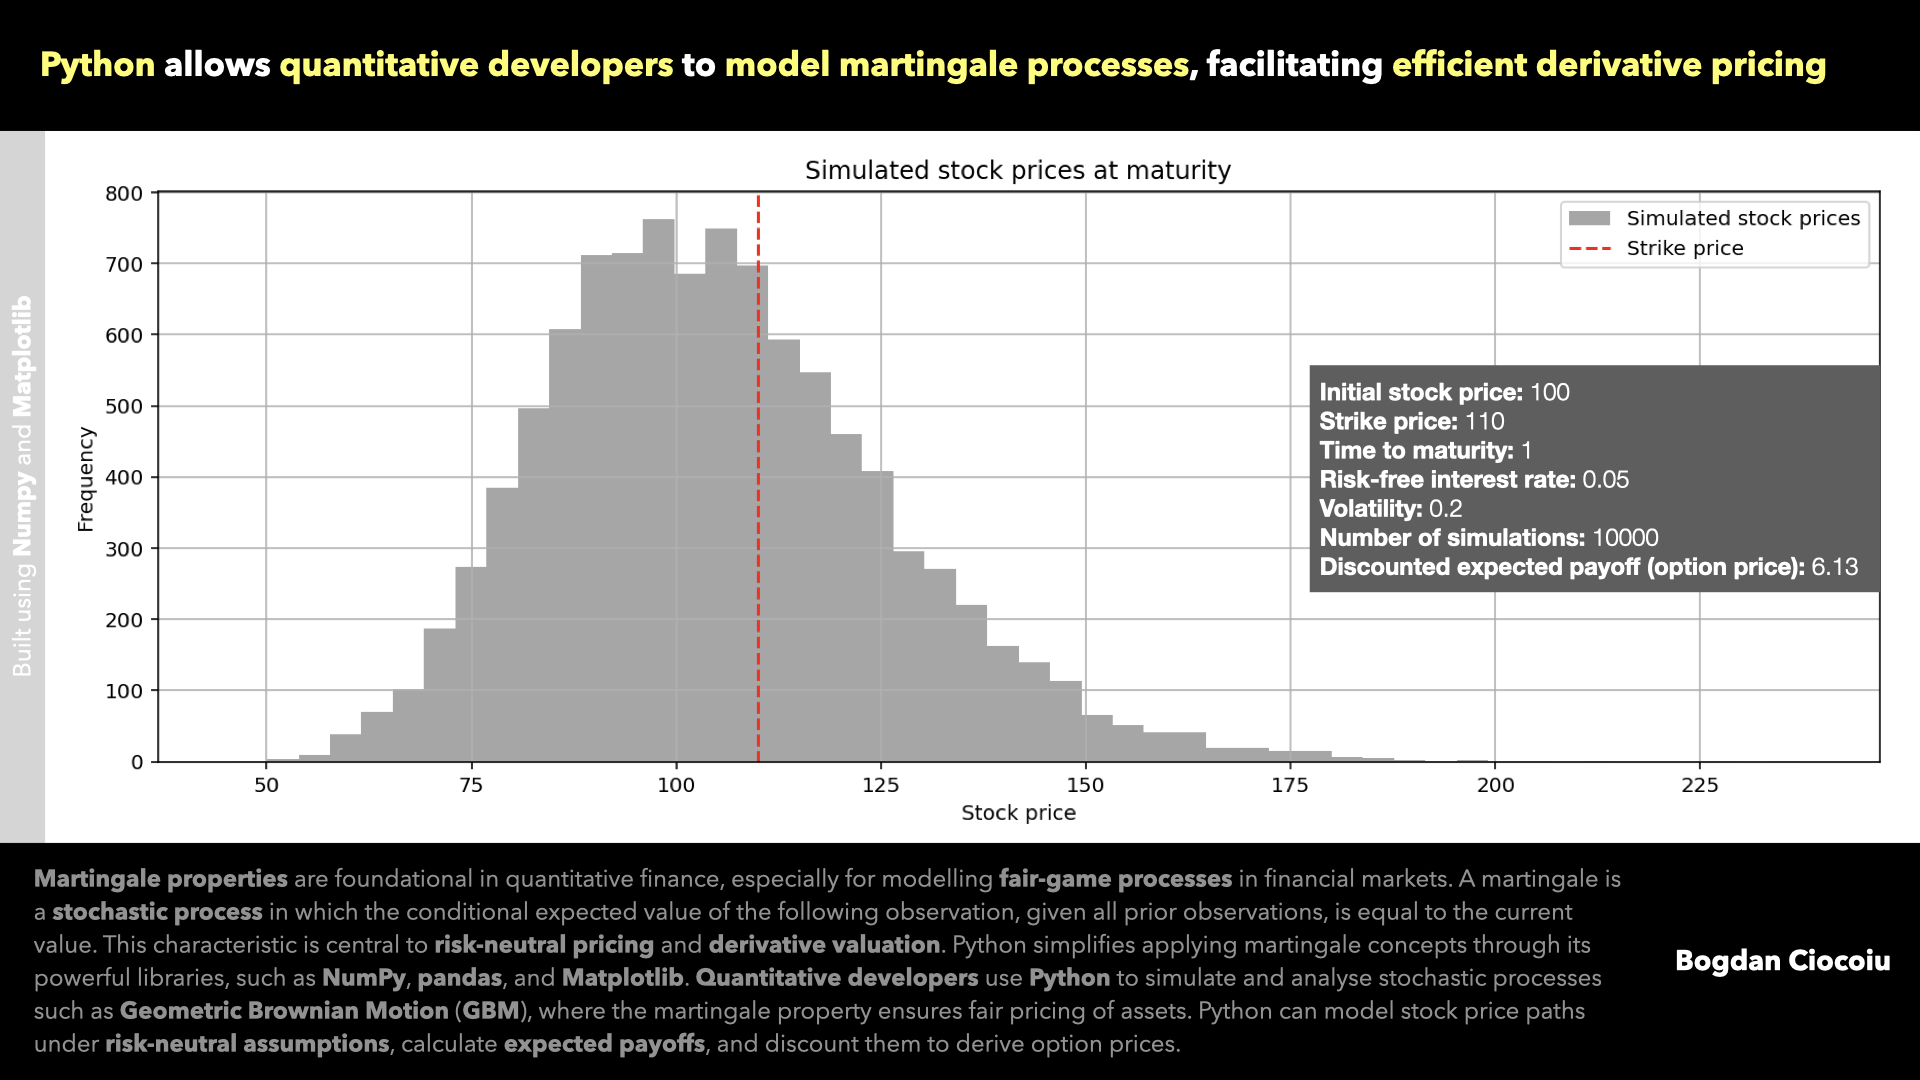
Martingale properties
Martingale properties lie at the core of modern financial theory and quantitative analysis. These properties describe stochastic processes where the conditional expected value of the next observation, given the current and past values, equals the current observation. In simple terms, martingales represent “fair games” where…
-
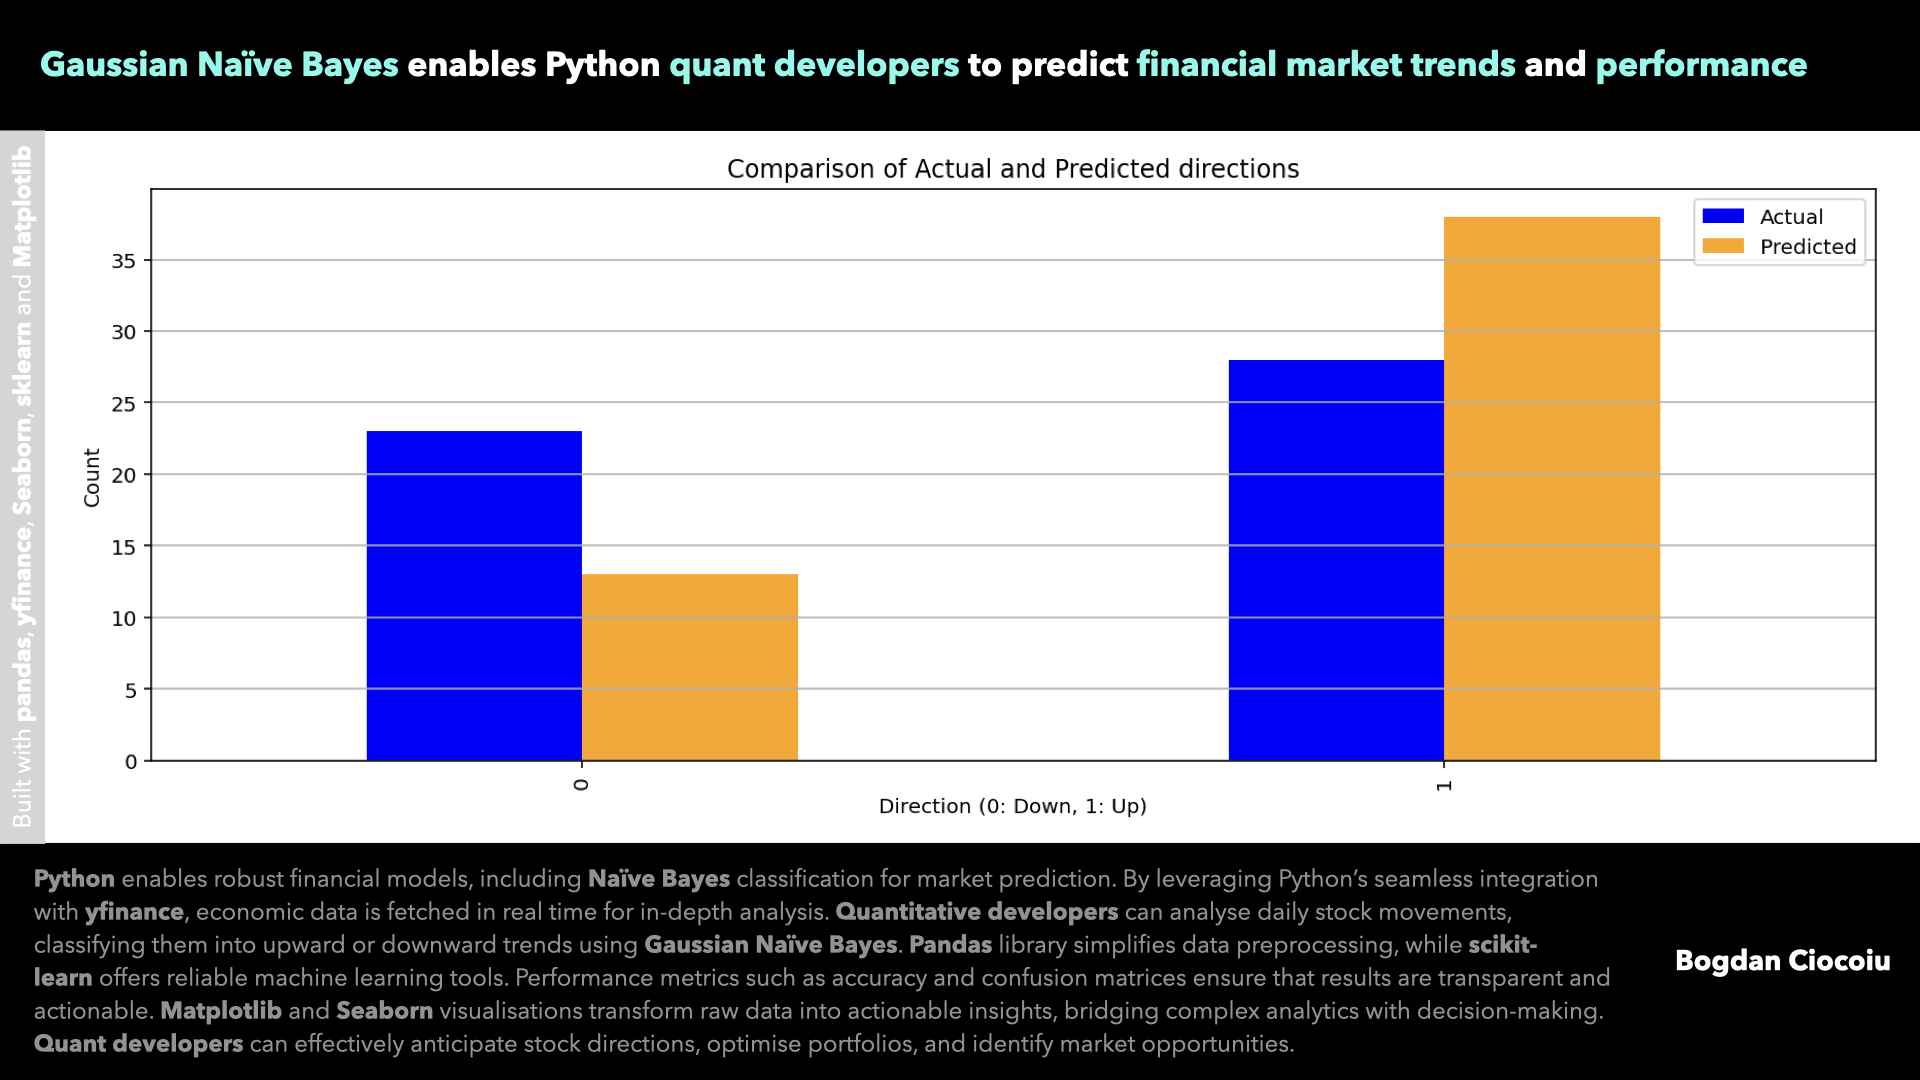
Supervised machine learning – Gaussian Naïve Bayes
In quantitative finance, having access to precise data analytics and advanced predictive models is key. With its versatile ecosystem, Python has emerged as an indispensable tool for quantitative developers seeking to optimise investment strategies and forecast market movements. One such…